This is an Eval Central archive copy, find the original at depictdatastudio.com.
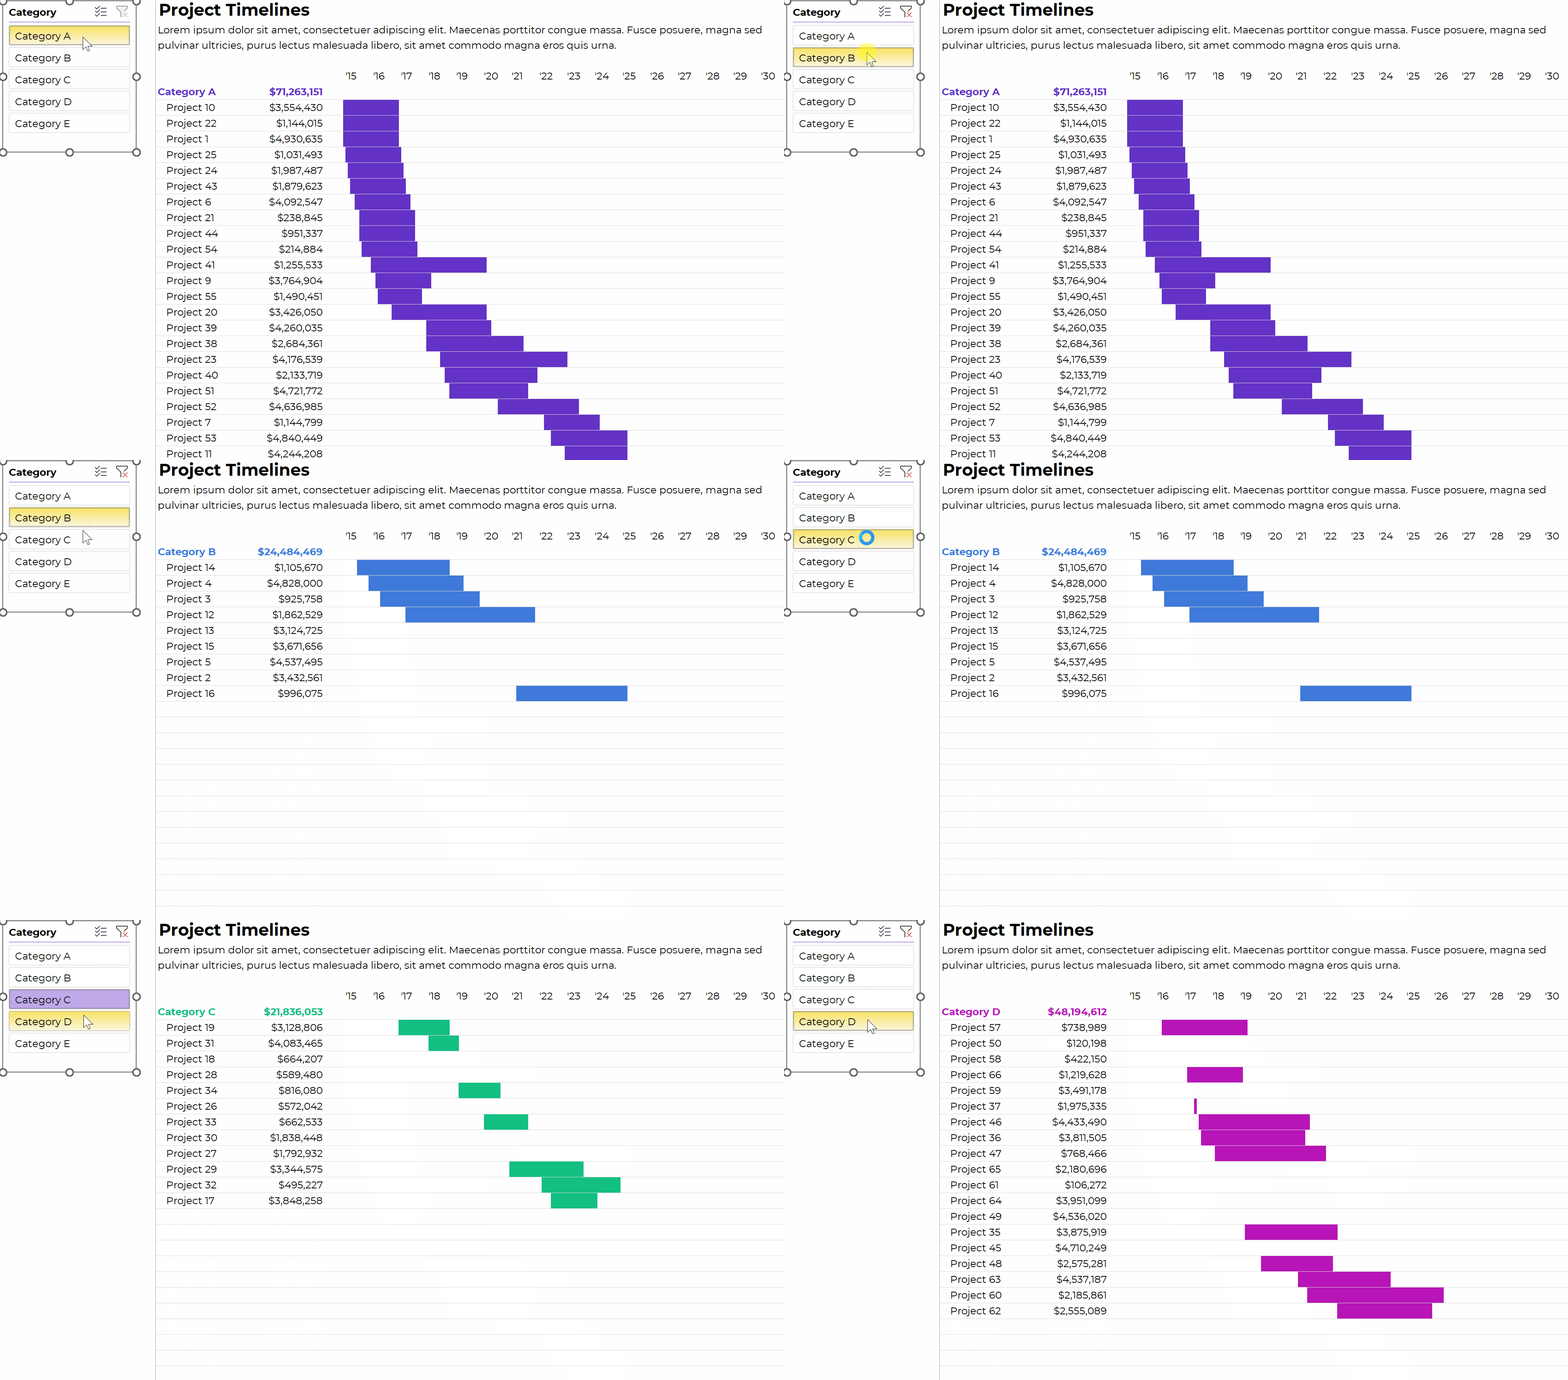
I spent a couple hours livestreaming, and created this masterpiece:
a slice-able Gantt chart that automatically updates and populates itself when you add more rows to your dataset (i.e., no tedious manual updates).

How to Make Slice-able Gantt Charts in Excel
You can watch the high-level tutorial here:
What’s Inside
- 0:00 Intro
- 1:08 The end product: Slice-able in Excel. or printed/PDFd
- 1:52 Gantt chart options in Excel: 1) Stacked bar chart or 2) Inside cells, like this
- 3:50 Dataset
- 5:51 Pivot table
- 6:29 Slicer
- 6:40 List of projects and their amounts
- 8:30 Helper cells to the left and above
- 9:55 AND formula to fill in the body of the table
- 11:18 Conditional formatting
- 12:50 Theme Colors
- 13:40 Your Homework List 41:17 Want more details? Watch the 2.5-hr livestream
- 14:37 Download this Gantt chart
Download the Excel File
It’s here.
Related Resources
- The full livestream where I created this from scratch
- Helper cells