This is an Eval Central archive copy, find the original at freshspectrum.com.
Why are so many organizations still stuck in a PDF rut?
I’ve been blogging since around 2008. For context, I started on WordPress well before I had my own business, years before I started drawing comics, and even before I really started getting into data visualization design. My first blog posts were about technology, data collection, and sociology.
In the early days, starting a blog was just so easy. And it’s even easier now.
But even though writing and sharing on the web is so simple, most organizations are still so committed to the idea that they have to share their reports first and foremost with a PDF.
It’s a habit.
And it’s time to break that habit.

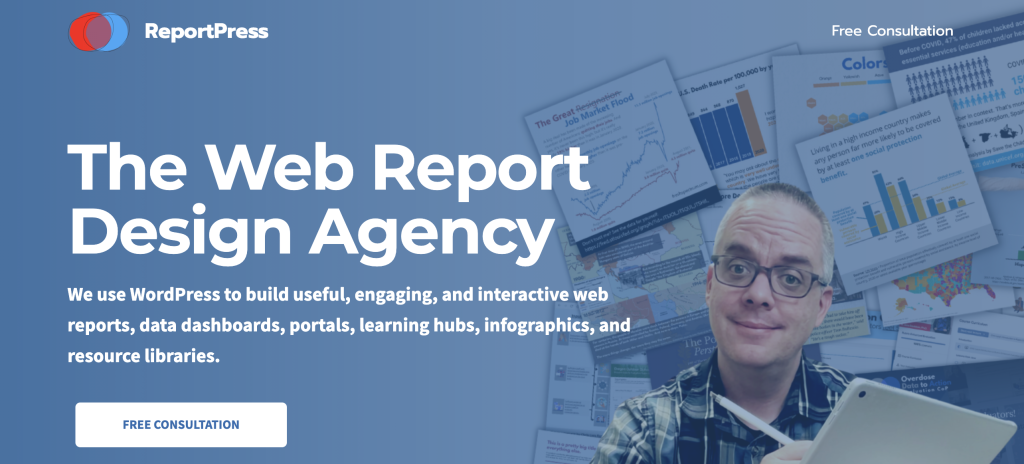
Officially Launching my Web Report Design Agency
For years I’ve had this idea. What if instead of creating a report in Word and sharing via PDF, we developed a report like you would develop a blog? But I didn’t really do anything about the idea, it just kind of sat there in my head.
Then last year I decided to take some action. I shared a little bit about what I was thinking here on this blog, then found a couple of early partners. I let them know it was a concept, and that I would be making things up as I go.
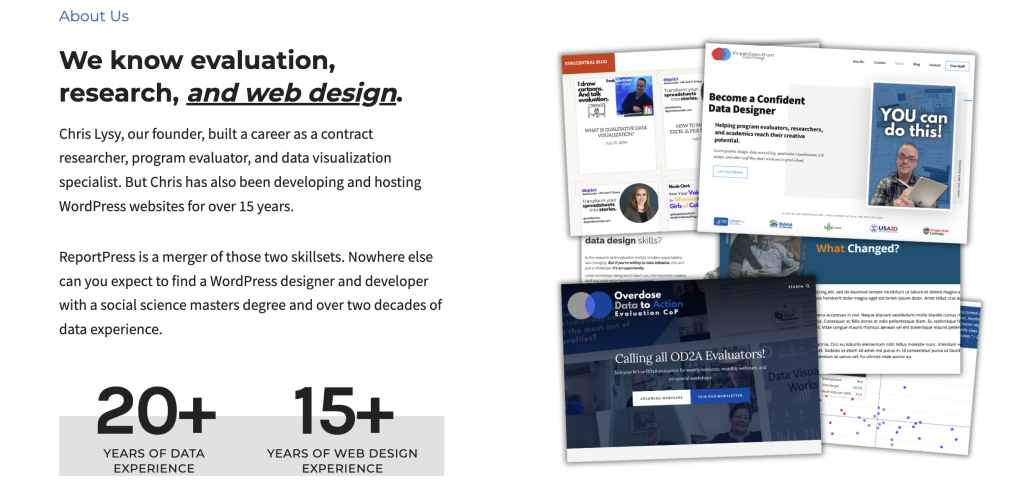
Now, about a year later, I have successfully created a handful of reports and dashboards using WordPress. Not only did both of my early partners appreciate their reports, but both came back with follow-up projects. They also both referred my services to others!
For a test run, I could not be more happy with the results.

3 Early Lessons Learned from ReportPress
So I’m still early on with this experiment, but I have learned a few really important lessons.
1. Web Reports are Easier to Design than PDFs
I know how to use Word & PowerPoint. I know how to use Adobe InDesign. I know how to use Canva. I have designed reports professionally using all of these tools.
Designing reports with WordPress is easier.
WordPress makes it really easy to collaborate with multiple report authors. Because it’s web, section length doesn’t matter as much. You can tweak full sections at the last minute without breaking anything. It’s easier to illustrate. It was almost surprising to me how easy it was to design the reports as we went.
2. Web Reports are Far More Engaging than PowerBI & Tableau Dashboards
A lot of people have the wrong idea when they start creating dashboards. They think that it will make their data more engaging. But that’s not really true.
Dashboard tools let you share a lot of data in a smaller amount of space. They allow for greater access to the kind of information that usually gets buried inside of SQL databases or lost within collections of Excel spreadsheets. But increasing access does not make data more engaging.
For data to be engaging, you need to build in story or pair it with narrative. It is so much easier and more effective to do that with a blog than it is to do that with a traditional dashboard. With a Web Report, you can still offer interactivity, but you can also take a narrative first approach. Designing your reports more like interactive NY Times stories.
3. Living Reports and Learning Hubs are Possible
One of my latest projects involves building a learning hub. Instead of building a one off report, we’re experimenting with using the blog capabilities to create an ongoing “evaluation journal.” The biggest challenge this poses is not technical, but process.
The idea is to post information as you go, instead of compiling it over time for a later release. This means changing hard set habits, but it creates opportunities. So much interesting back and forth happens in email these days. That means it’s not stored in an easily archivable/date stamped format. But with a blog, that archivable, categorizable, and updatable format is the default.
Testimonials from Summer & Nina
Want to hear what my partners had to say about this work?
“Having worked with Chris on multiple projects, I’m especially impressed with how he can create a visual “feel” that really matches the client’s and project’s needs and style. Whether the work highlights a lot of quantitative data through clear, attractive charts and such, or focuses more on qualitative data and visuals to tell a story, Chris creates inviting, engaging, interactive reports that our clients are uniformly thrilled with.”
Summer Wood, Co-Director, Ampersand LLC
“ReportPress is a game changer for our deliverables. We worked with Chris to turn a static report into an interactive website that was branded for the client, visually compelling, and centered user-experience. Rather than scroll through a lengthy report, users can easily navigate to what’s most important to them. I highly recommend working with Chris to transform data products into something useful and engaging. Plus, Chris is awesome to work with!”
Nina Sabarre, Founder + CEO of Intention 2 Impact
Interested in working with me to create your own Web Report?
Check out my new website at ReportPress.net.
