This is an Eval Central archive copy, find the original at freshspectrum.com.
So I have to admit something. I am HORRIBLE at multitasking.
For example, I can’t look something up on my phone while having a conversation. I can’t cook dinner while putting together a grocery list.
“How about listen to your wife while doing anything else?” my wife added after I had asked her for examples.
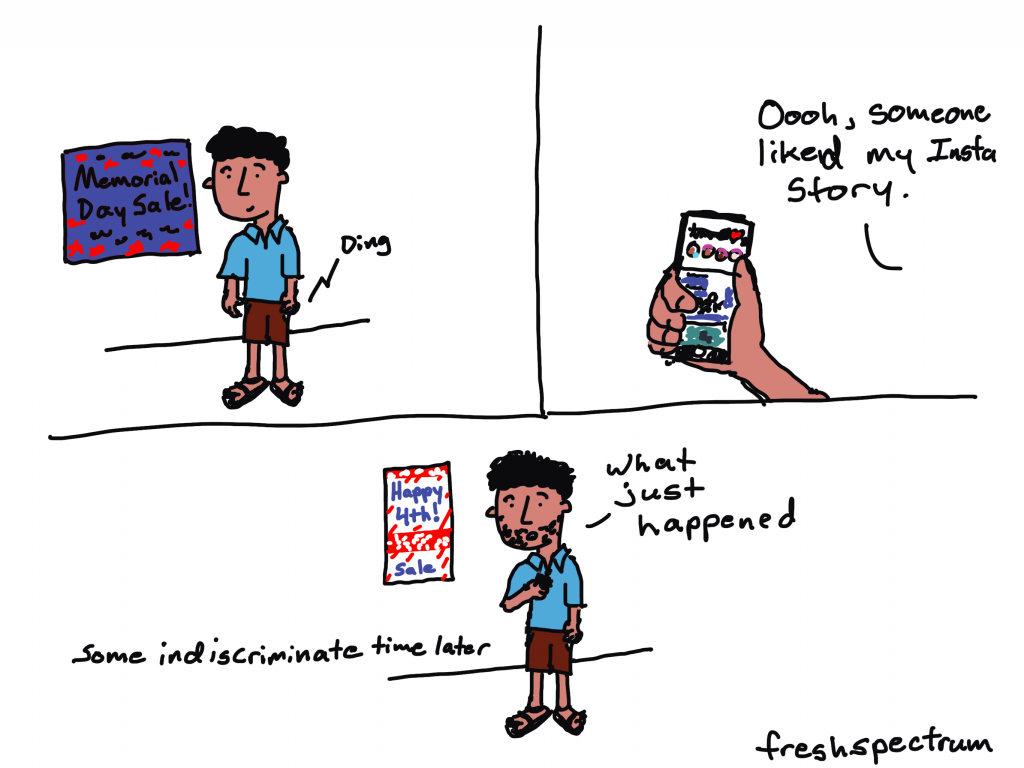
But the truth is, I’m not alone in this bad at multitasking thing. Most people are really bad at multitasking.
…individuals almost always take longer to complete a task and do so with more errors when switching between tasks than when they stay with one task.”

So what does multitasking have to do with report writing?
If it truly was just report writing, there wouldn’t really be an issue. But modern report writing isn’t just report writing.
Creating a modern visual report requires a mix of at least three major tasks:
- Writing
- Illustrating
- Designing
One of the biggest mistakes that can slow down a reporting process is trying to accomplish all three of these major tasks at the same time.
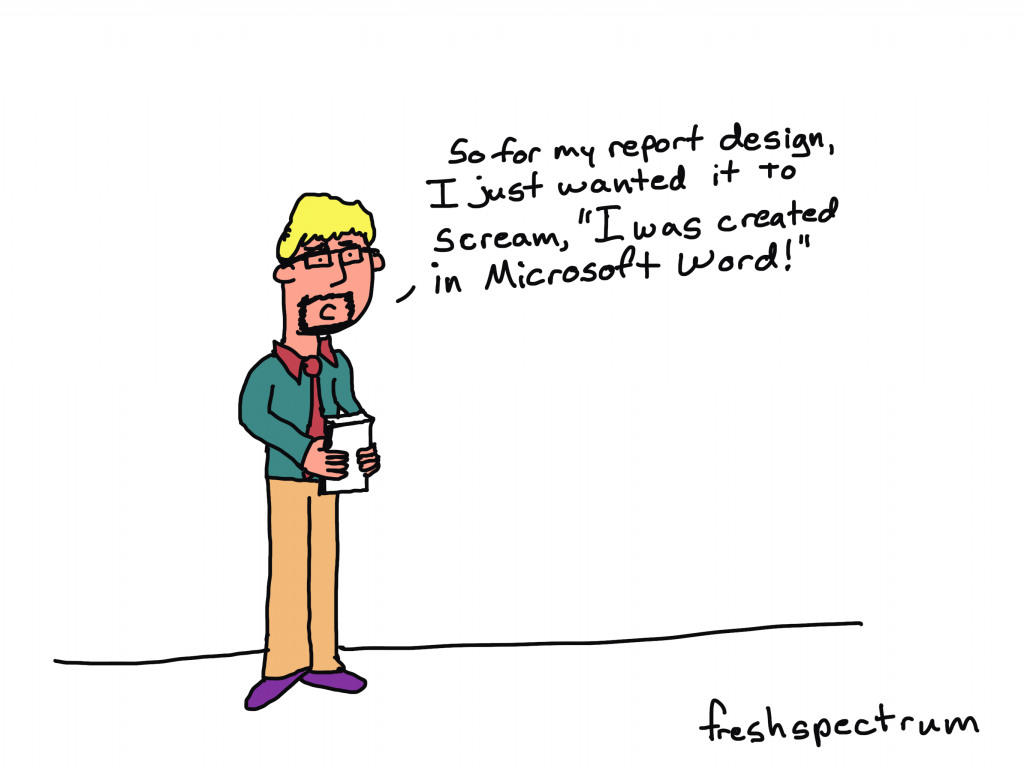
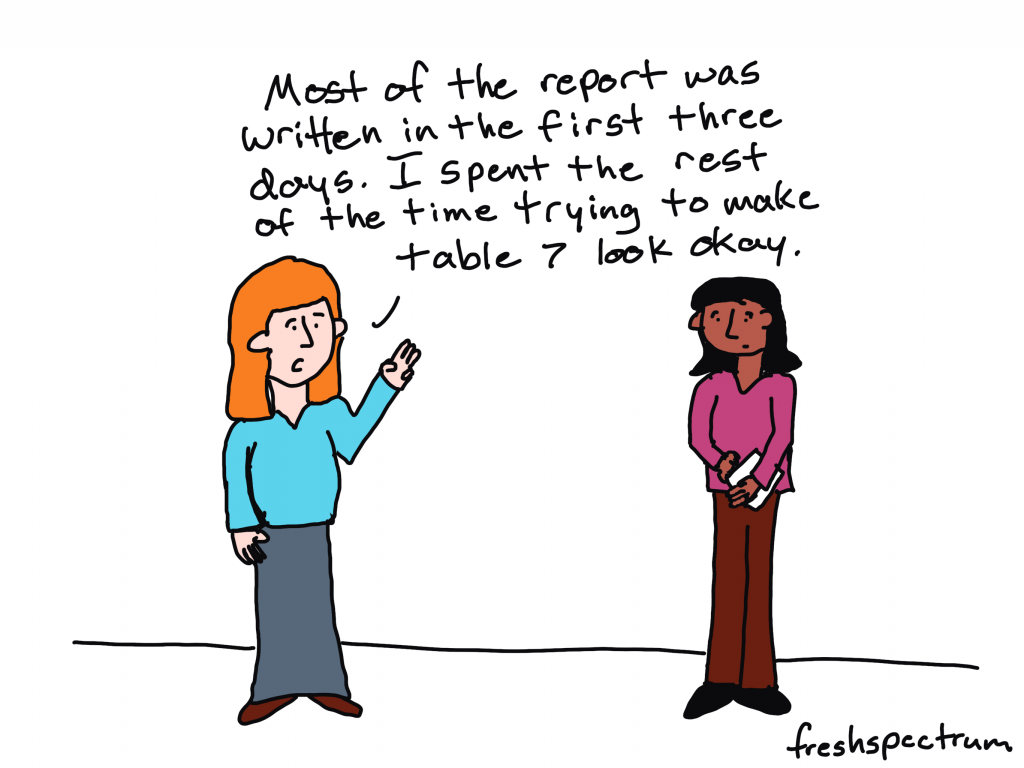
You can complain all you want about Microsoft Word, but you were the one who decided to spend 30 minutes tweaking the design of a table that will eventually need to be recreated in Adobe anyway. You were also the one who spent a bunch of time creating a chart in Excel that will need to be redesigned with new brand colors and fonts.

How to single task your report writing.
The solution to the multitasking issue is to intentionally single task your reporting process. This means separating out the different report creation tasks.
Let’s talk about each one of the big three individually.
- The design task.
- The writing task.
- The illustration task.
1. The design task.
So I listed the design task first. This was intentional.
Lots of evaluators tend to think about design as being something you do after you finish your report. But this can be a pretty big mistake.
Here is what happens. Evaluator sits down to write report, opens up Word. Proceeds to brain dump into word document. When nearing end of draft 1, decides that nobody would likely want to read their stream of thought 200 pages.
Okay, so maybe that’s an exaggeration (I hope). But you get the point. One of the things that happens when you just write first is that you tend to over do it. You write more than you need, and sometimes WAY more than you need.
Even before you put pen to paper you know certain things that will influence the design of the report.
Such as…
- Target page count.
- How visual you want the report.
- The branding guidelines for your organization.
- The sections that need to be included.
Take all of that and design a report shell with the proper fonts and colors. You can change this later, but having it will show you how many words and pictures you’ll need. It will also give you a sense of what you can’t fit, and save you from writing things that will definitely get cut.
And if you don’t know the proper fonts, colors, and other branding guidelines, now is the time to find out.
2. The writing task.
Now that you know where you’re headed, it’s time to start writing.
This is the time to open up Word or Google Docs. Don’t worry about formatting, charts, or pictures. Just the words. Also make sure to use headings and subheadings where appropriate. And if you have something you want in a call-out box or sidebar, don’t bother creating the call-out box or sidebar. Just write something like “Sidebar:” as a header for the text.
And what about data tables? I would suggest putting in the data tables, but not worrying about the formatting. As long as it is readable. Often it can be really helpful to see the numbers you are discussing during the writing process.
Eventually you are going to take the words from this document and put them into the report shell. But I suggest waiting until you’ve gone through most, if not all, of your drafts and revisions.

3. The illustration task.
So illustration is not the same as design. During the design process you are going to put in placeholder images and charts. During the illustration process, you are going to create your images and charts.
Data visualization is an illustration task. Your goal is to make the data approachable, and you also want it to fit within the context of your report.
Creating explanatory figures and diagrams is an illustration task. Your goal is to create a visual explanation, and fit it within the context of your report.
Deciding on stock images is also an illustration task. The types of visuals you choose should support the words in your report.
Bouncing back and forth.
Okay, so this is almost never entirely chronological. You are likely going to have to task switch throughout your reporting process. But do it intentionally.
I usually start with design then go into writing. After writing I Illustrate. Then I go back into design mode to pull everything together. I also might need to tweak the designs where the content demands a different approach.
If you are working with a team, get feedback at all the different stages. Approve the design shell/template before putting in all the words. Try to get the writing as complete as possible before putting it all into the template (multiple revisions). Same with illustrations.
All the other tasks.
So designing, illustrating, and writing are not the only tasks required when writing a report. You’ll also likely need to incorporate tasks like proofreading, editing, sourcing, accessibility checking, etc. Just like with the other tasks, separate those parts of the process.
How do you create your reports?
- Do you start with notecards or sticky notes?
- Do create your design shell first, or just open up Word and start writing?
- Do you treat illustration as a separate task or just insert images/charts as you write?
- Do you start by building a detailed outline with bullet points and goals for each section of your report?
Let me know in the comments.