This is an Eval Central archive copy, find the original at freshspectrum.com.
Dissemination should be easy.
It’s just sharing our findings and ideas with people who we think might be interested. If it’s hard, it’s because we make it hard.
Let’s make it easy instead.
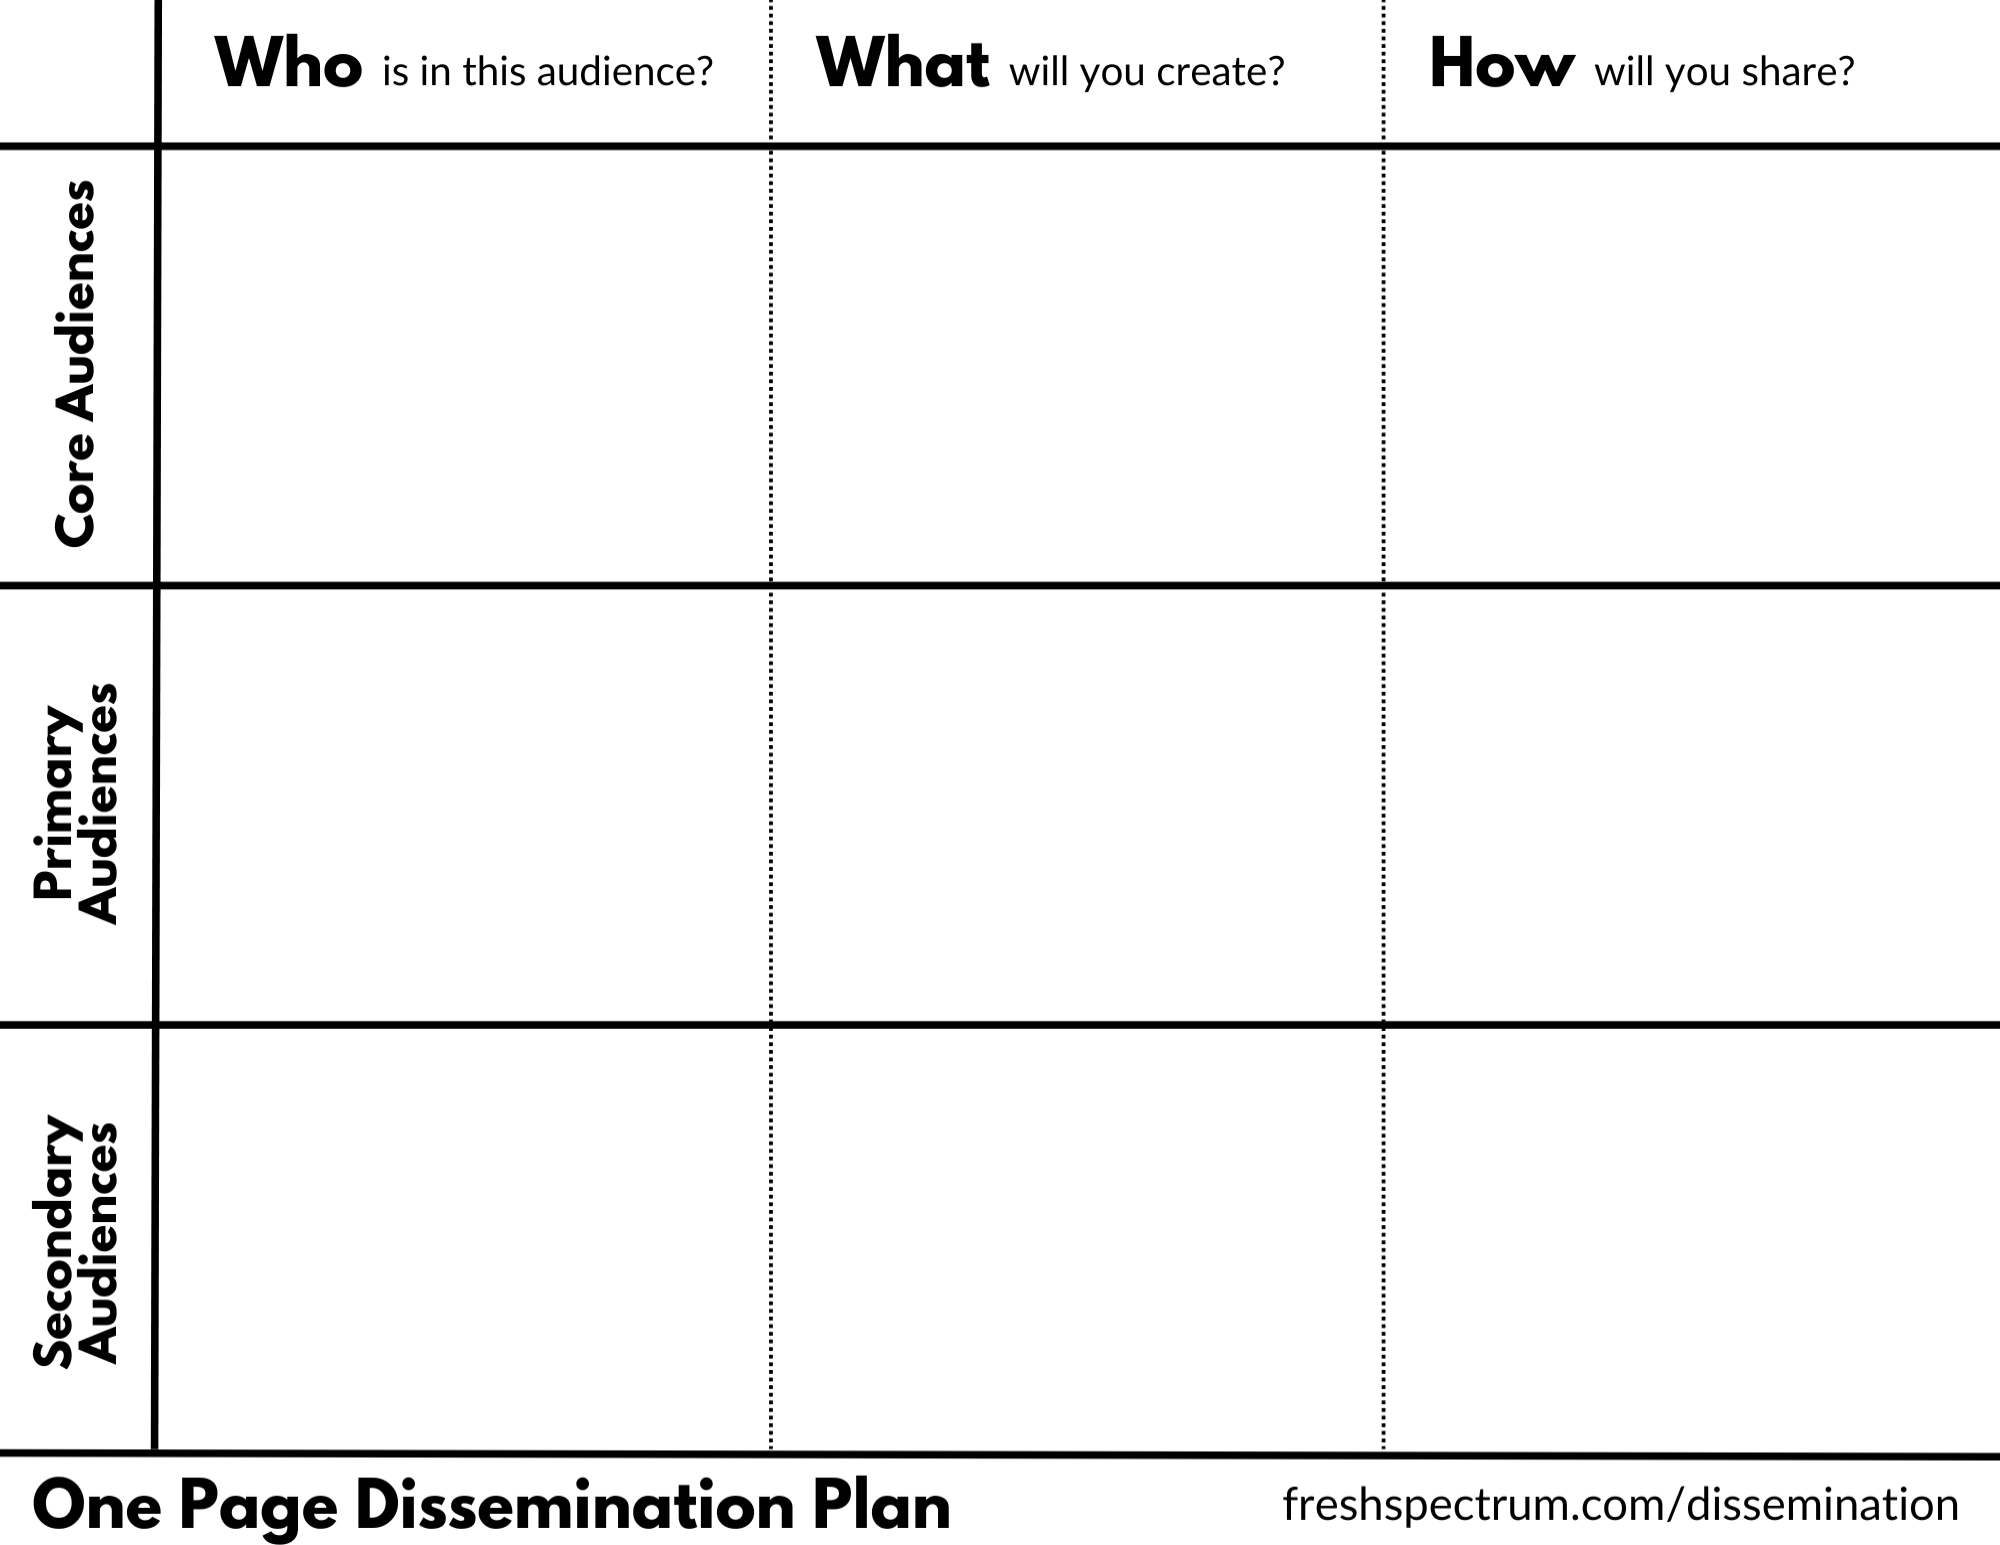
The One Page Dissemination Plan
At the bottom of this post you’ll find both a link to a Canva template and fillable PDF. It’s landscape, 8.5 in by 11 in.

How to use the plan.
In short, you break your different audiences into three groups. Then for each audience group, you ask who is in the audience, decide what product you will create to reach them, and then jot down how you will share that product.
This is a content strategy plan.
What does that mean? It means that you adapt your work into different pieces of content with the intention of reaching different audiences or communicating through different channels.
You can think of it as report diversification. A printable executive summary might be great for the next board meeting. But it would not make sense to share that PDF executive summary on LinkedIn. It would make far more sense to adapt that summary into a social media carousel.
Adaptation creates more opportunities to share, without diluting or distorting original work designed to be more technical.
This should NOT include your technical report.
I suggest treating your technical report as the product of your evaluation. It documents your methods, defends your decisions, and delivers your analysis.
While a technical report is often a key source in support of your dissemination efforts, it is a mistake to treat the technical report as if it’s easy to share content. It’s probably not. And honestly, it’s also not worth the time it takes to make it easy to share content.

The three audience approach.
Perhaps you’ve gone through the step of thinking through your reporting audiences. And if you’re like many evaluators and researchers, you might even have a list of audiences.
The audiences might include your boss, your boss’ boss, a non-profit board, program managers, program staff, participants, clients, politicians, funders, etc.
It’s hard to design for a list. It’s also overwhelming and time-intensive to design reports for each audience individually. So I suggest splitting your audience into three.
Who is in your Core Audience?
These are the people who would feel compelled to read your report even if it were ugly, long, and boring.
It’s a small group. It likely includes your boss or your client. It might include a few other highly involved stakeholders or board members.
Designing for this group is about making the technical more approachable. Normal reporting content like executive summaries, one-pagers, and presentations usually work just fine.
How will you share the work? Probably through an email from your personal account. Or maybe through a Zoom meeting or an actual in-person get together.
Who is in your Primary Audience?
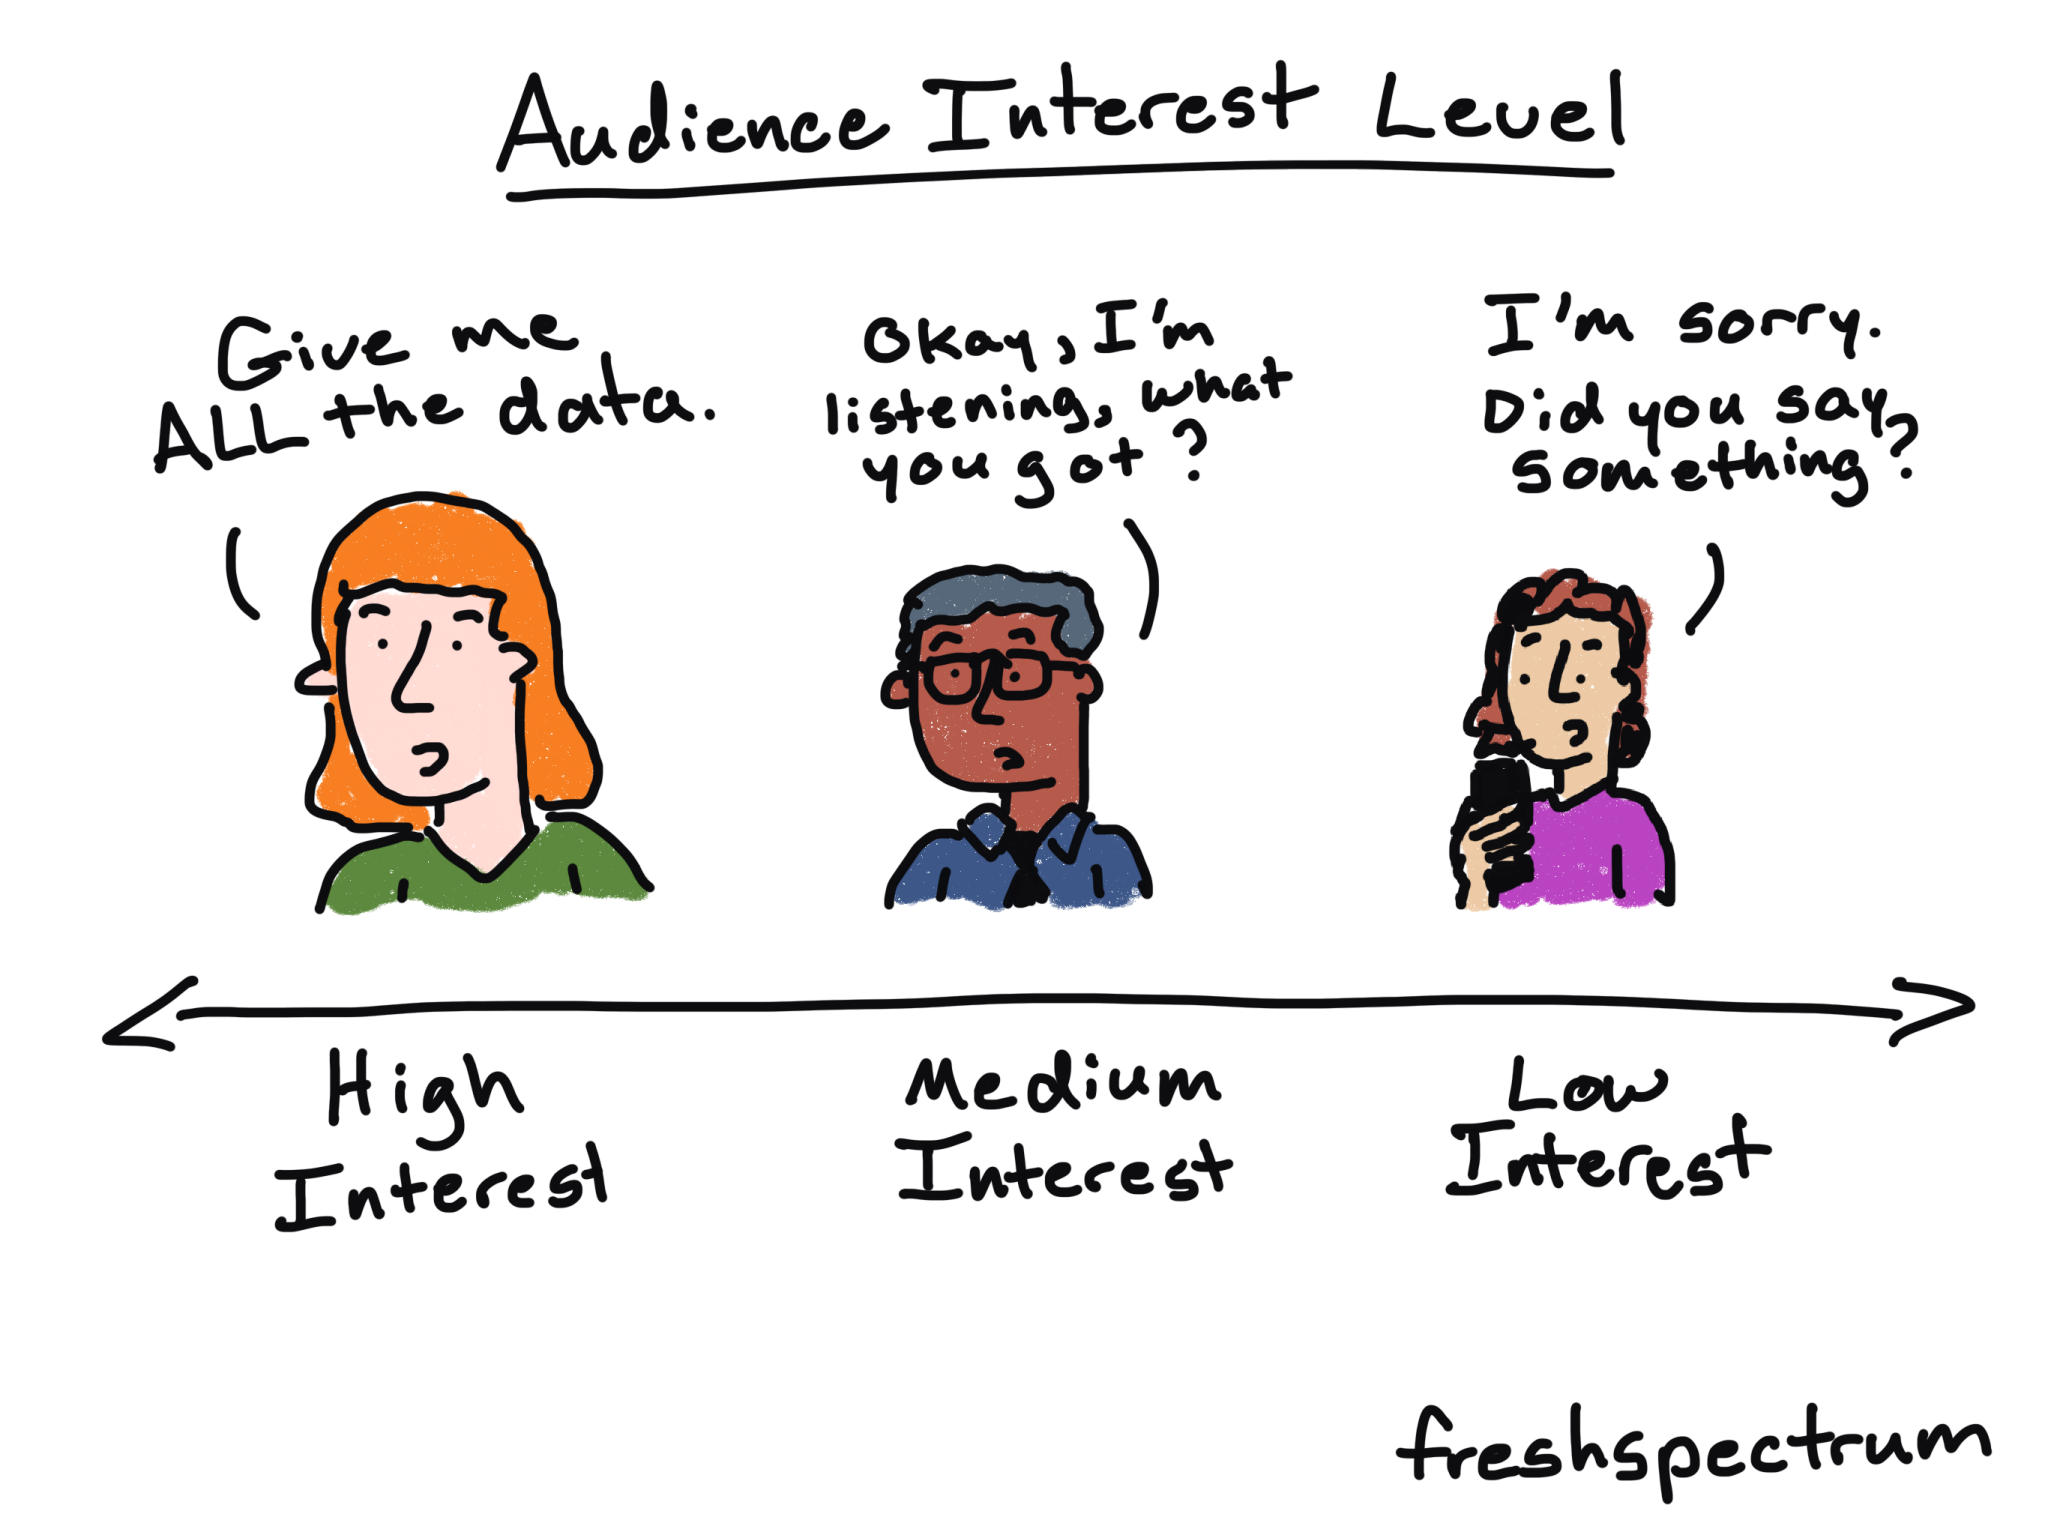
I like to think of your primary audience being the people who could get the most value from you sharing your work. This might include program managers, project staff, politicians, and funders. Compared to the core audience, they will not be compelled to read your report.
Designing for this group is about making the technical report more relevant and accessible. All audiences are overwhelmed right now so you need to make the reporting as easy to access as possible.
Some of the reporting content that works particularly well for this audience includes visual reports, case studies, slidedocs, blog posts, infographics, video, interactives, html reports, and webinars.
You may have direct emails (if you do, use them). If you don’t have their emails you’ll have to use social media, search-friendly content, and referrals. By referrals I mean gaining access to spaces where the target audience already has a relationship. For instance, a partner organization that already sends a newsletter to the people you want to reach.
Who is in your Secondary Audience?
I like to think of your secondary audience as being people who may have an interest in your work, but it’s not necessarily clear-cut. Or they may have an interest in just a very specific aspect of your work.
These are your “general public” audiences but could also include program participants, families, and academic colleagues.
You likely do NOT have a direct path to reach this audience. Reaching these audiences means leveraging social media, search-friendly content, and referrals. Small infographics, short videos, and targeted social media can help your work travel to these secondary audiences.
3 Audiences, 3 Questions, and 9 individual blocks.
You can access the Canva template below (just make sure to sign up for Canva/sign into your Canva account first). You can fill it in online or print it out. It’s also simple enough to just draw the grid on a whiteboard or piece of paper.
Or, if you prefer a fillable PDF, here you go!
Good luck. And if you use it or plan to use it, let me know.
