This is an Eval Central archive copy, find the original at freshspectrum.com.
If you are serious about creating better reports, it’s time to take a step back. In this post I’m going to share my F.R.E.D. method for evaluating modern report dissemination.
But let’s start with something I’ve learned slowly over the last two decades of my data design career.
The biggest problem with most evaluation, research, and data reports is NOT the quality of the charts or visual design of the report. The biggest problem IS that most reporting is not designed to reach and engage an audience.
You can create the most interesting, delightfully designed, value packed report and still fail at reporting. Because if that report does not fall into the hands of your target audience, that report will not have an impact.
So how do you assess whether or not your reporting is reaching your audience?
You can use my F.R.E.D. method.

Why tracking PDF downloads is not enough.
PDF downloads is a pretty lame measure without any additional context.
It tends to be used like any other vanity metric (ex. social media followers). Without knowing how many people are in your target audience, which members of your target audience actually know your report exists, or even how many members saw your download page (without downloading), it’s just an out of context number.
Is 100 downloads good? What about 1,000 or 10? Any of these can be an absolute success or disappointing failure. But if you don’t do a little extra work, you won’t have any idea of what success looks like.
What is the F.R.E.D. method?
F.R.E.D. stands for Frame, Reach, Engage, Deliver. These are the four basic steps I would suggest you follow when evaluating your reporting efforts.
For the sake of this post I am going to assume you are actually interested in report engagement and uptake. I’ve talked about this a lot in recent presentations, like the Eval Cafe I delivered for the Evaluation Center at Western Michigan. There is a big difference between a technical report and the kind of reporting designed for reach and engagement.
Let’s walk through each phase one by one.
FRAME your audience.
For a lot of evaluation reports the audience is either unidentified, a laundry list of disconnected groups of people, or generically described through the use of blanket phrases like “the general public.” It’s often nebulous or just a bunch of wishful thinking.
I would suggest that for each and every identified audience type, you should be able to identify by name a specific member of that audience. If you can’t, you’re likely too disconnected to actually reach that audience. That is, if it exists at all.
Once you can name your audiences, try to frame them.
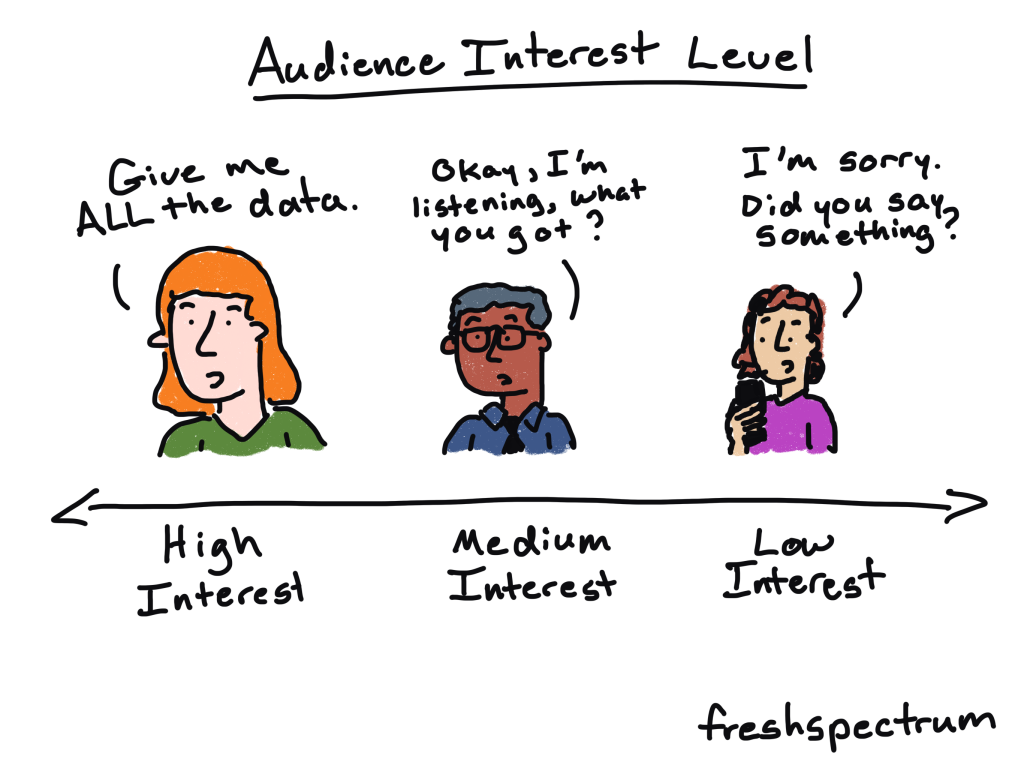
For one of my projects I was working with evaluation teams in ~66 individual state or local jurisdictions. For each team I could anticipate an average of 3 members. So in total, I would have an audience of about 198 (we’ll make it easy and round up to 200).
Additionally, we had other stakeholders that were part of our the broader audience. Around 20 members associated with the client and perhaps 50 more who were loosely connected.
I can total these audiences, but it’s actually more valuable to keep them separated. But running with this example, let’s say I have 270 members overall. Getting 2,000 downloads of a report would be incredibly bizarre and probably mean I reached outside my target.
Whom do you REACH and ENGAGE?
I’ll talk about these two together as the data for each is usually found in the same place.
REACH
A report reaches potential audience members when it shows up on a social media feed, inside their email inbox, or within web search results. You can REACH an audience member via social media even if they do not follow your account. You are not guaranteed to REACH an audience member just because they follow your social media accounts or subscribed to your email list.
REACH stats can be influenced through a good social media campaign, so it’s a good number to track.
REACH stats include Impressions, Opens, and Keyword Search Volume.
ENGAGE
A reader is engaged when they perform some action when seeing your report. This means they did not simply let it scroll by on their social media feed or mindlessly mark it as read in their email inbox.
ENGAGE stats can be influenced through content design, such as infographic design and copywriting.
ENGAGE stats include Reactions, Comments, Reposts, Retweets, Clicks, and Expands.
Finding REACH and ENGAGE stats.
You’ll find reach and engage stats mostly inside of your organization’s communication platforms.
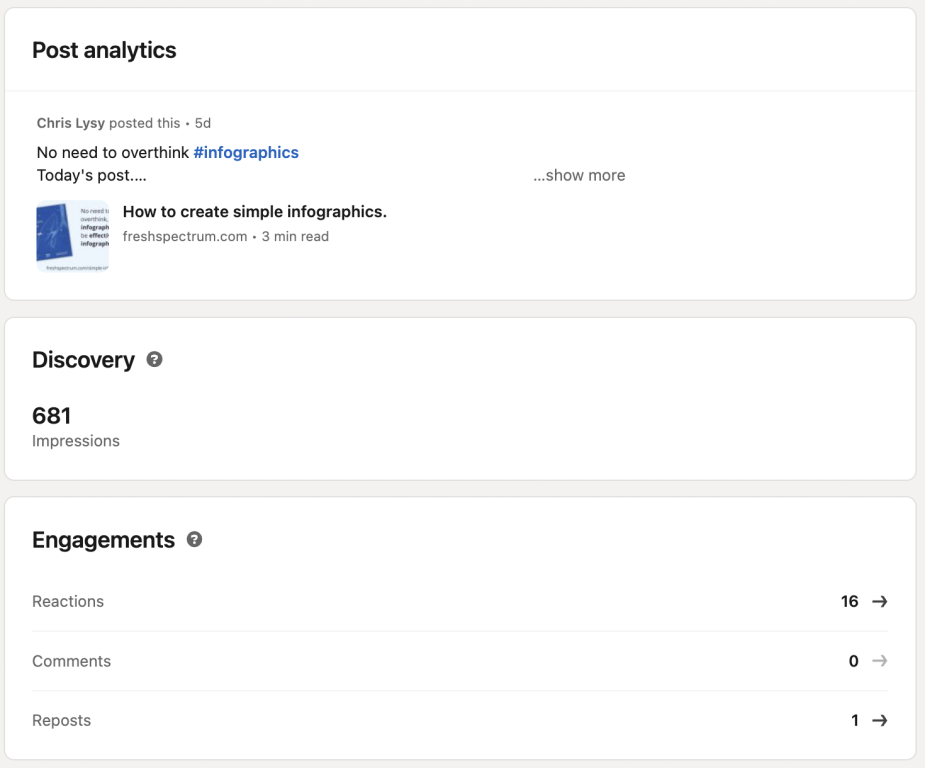
For instance, inside of LinkedIn you can see post impressions and view analytics for any of your own LinkedIn posts.
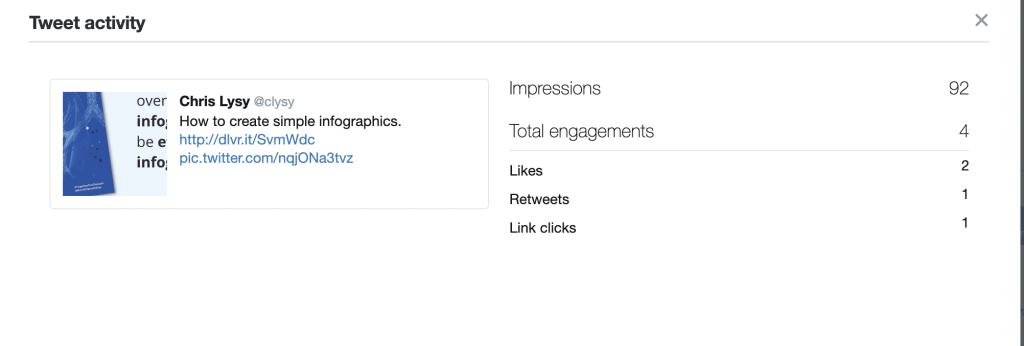
You can find the same information in Twitter (now X) by visiting analytics.twitter.com and logging into your account.
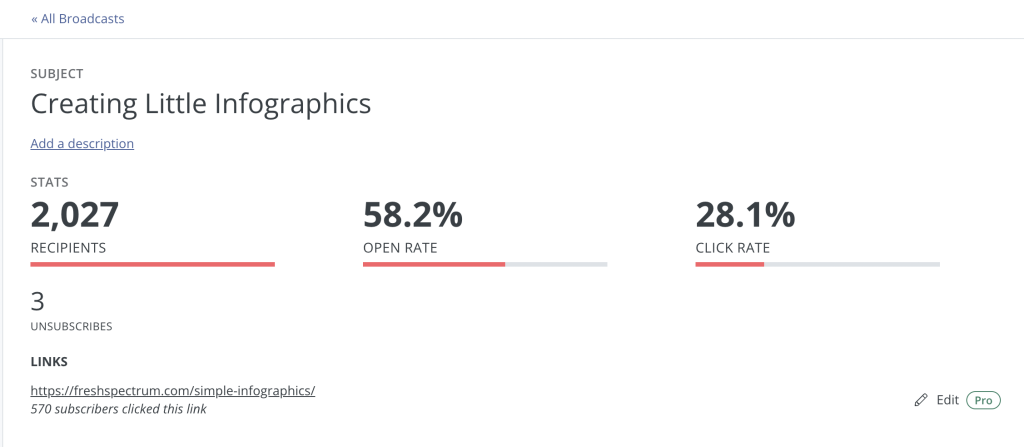
Most email providers will also give you data on recipients, opens (or open rate), and clicks (or click rate).
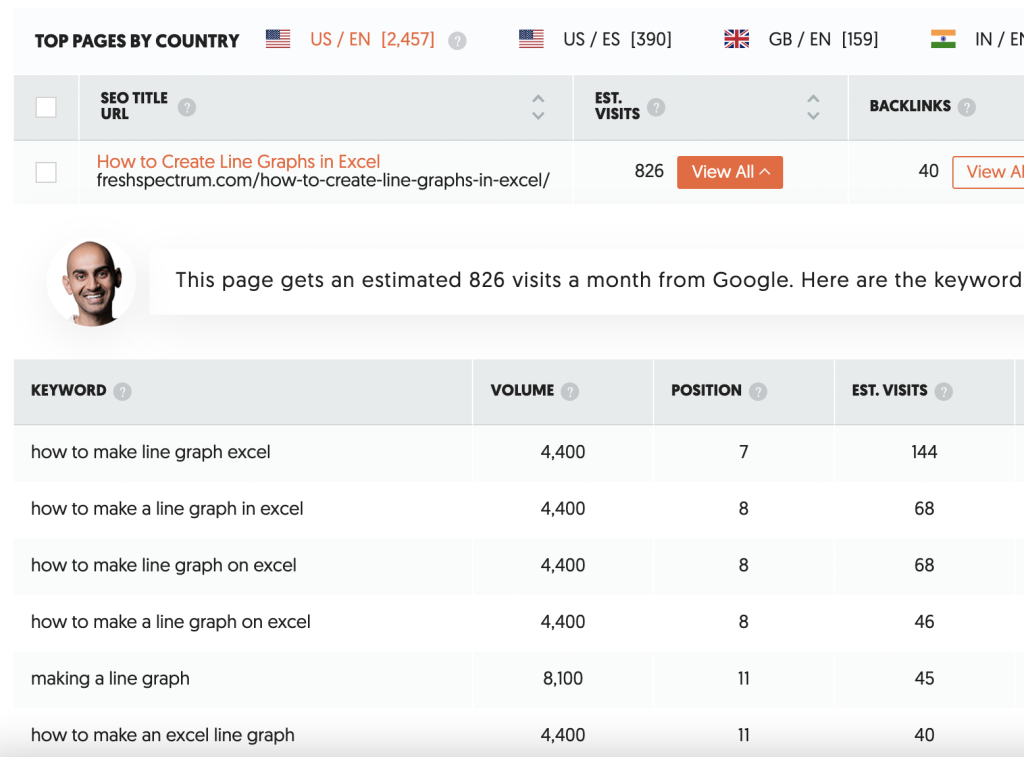
There are a number of tools that exist that allow you to see search engine stats. One of those tools is called Ubersuggest. Here you can search your page and find out its usual position in Google search results.
Based on the keywords where your page is found, the search volume for that term, and the relative position on the search page (lower the better), Ubersuggest provides you with estimated visits.
When is the report DELIVERED?
I like to think of reporting as a conversation but generally there is a desired reporting output. Historically the key DELIVER stat is often downloads.
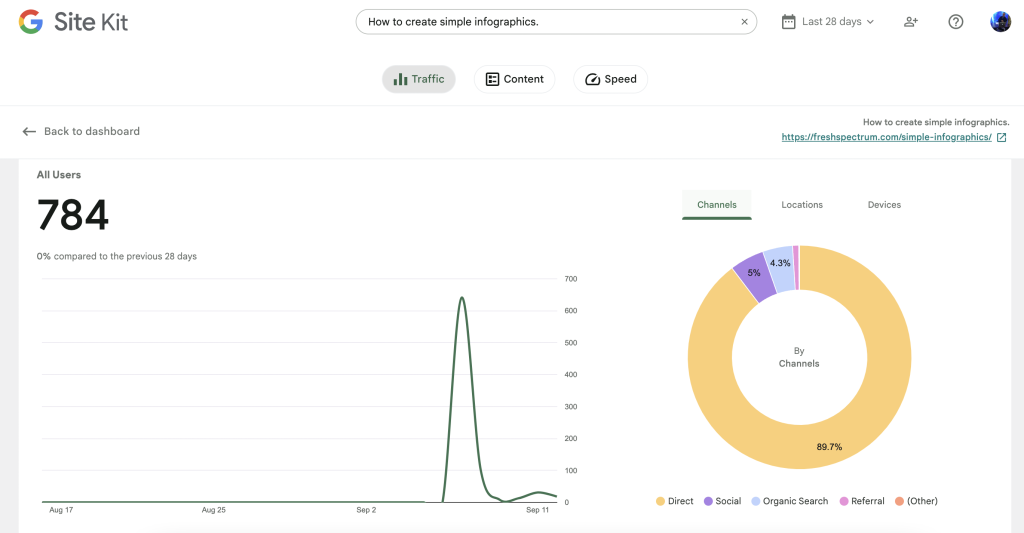
If your report exists in HTML you could also consider unique pageviews as a key metric. Then, if you would like to dive deeper, you can look at other stats like time on page or bounce rate.
If the bounce rate is high, it means people are visiting the page but not diving any deeper into supporting content. If the time on page is low, it means people are leaving quickly and not likely digesting much of your report.
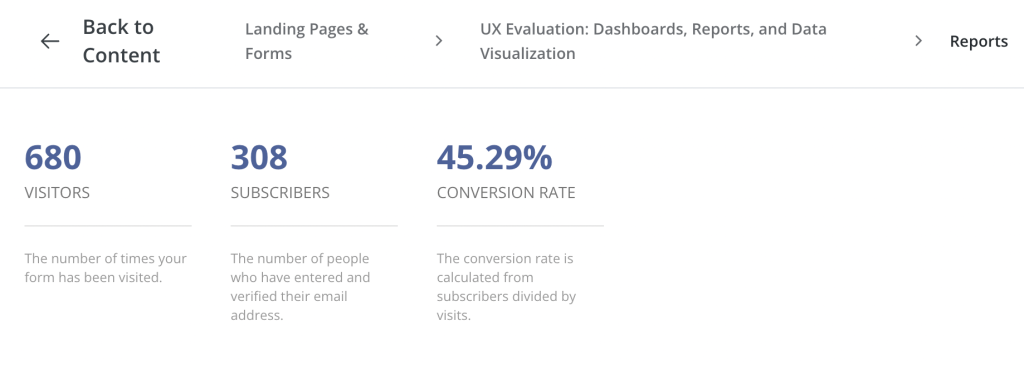
If you do decide to still deliver a downloadable PDF, that will also give you additional stats. You can find out how many people downloaded (or registered to download) your report. You may also learn how many people visited the page where your report is set to download.
TLDR Recap
Frame your audience: Try to identify real humans and come up with actual numbers to estimate audience size.
Whom do you reach? How many people actually noticed your reporting (ex. impressions & opens)? What percentage of your total audience had an opportunity to engage with your reports?
How many engaged? Of those who you reached, how many engaged with your work? This could be things like clicking on links in your emails or engaging with social media posts.
How many reports were delivered? Given the number that engaged, how many people actually viewed your web report? If HTML, how long did users stay on the page to read? If it was downloadable, how many were downloaded?
All of this information can be used in the future to help you improve your report delivery. Or in the present to be more strategic about reaching missed audiences.
More Resources
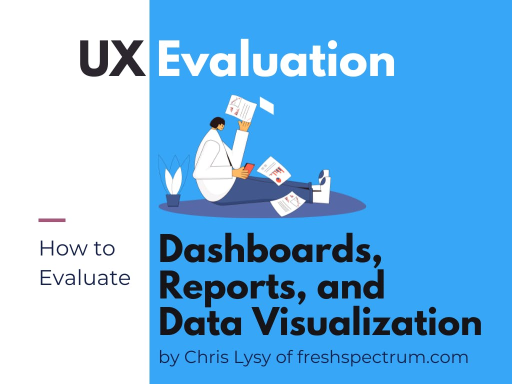
If you are more concerned about the quality of your reports, and not your reporting strategy, I have a guide for that as well. It’s my User Experience evaluation approach to evaluating dashboards, reports, and data visualization. You can download the eBook by following this link.