This is an Eval Central archive copy, find the original at freshspectrum.com.
Okay, long story short.
If you are presenting to a public audience, don’t just plop the embed code on your website. And if you don’t feel like reading about why, skip to the bottom of the page for how I would suggest you embed Tableau dashboards (and lots of other embeddable things).
Short story long? Continue reading.
What you see is not what Google sees.

Your web browser translates html and other code into a screen that you can see and read. But just because something looks like it lives on your website, doesn’t mean it does.
Google calls this content rich media. The star of rich media is video. Most video lives on YouTube, we just watch it through our web pages.
But this is something we should really consider when sharing data dashboards. We tend to be really concerned with what goes into a dashboard, but how often do you think about how it will be shared?
So if I embed a dashboard, Google won’t be able to crawl it?
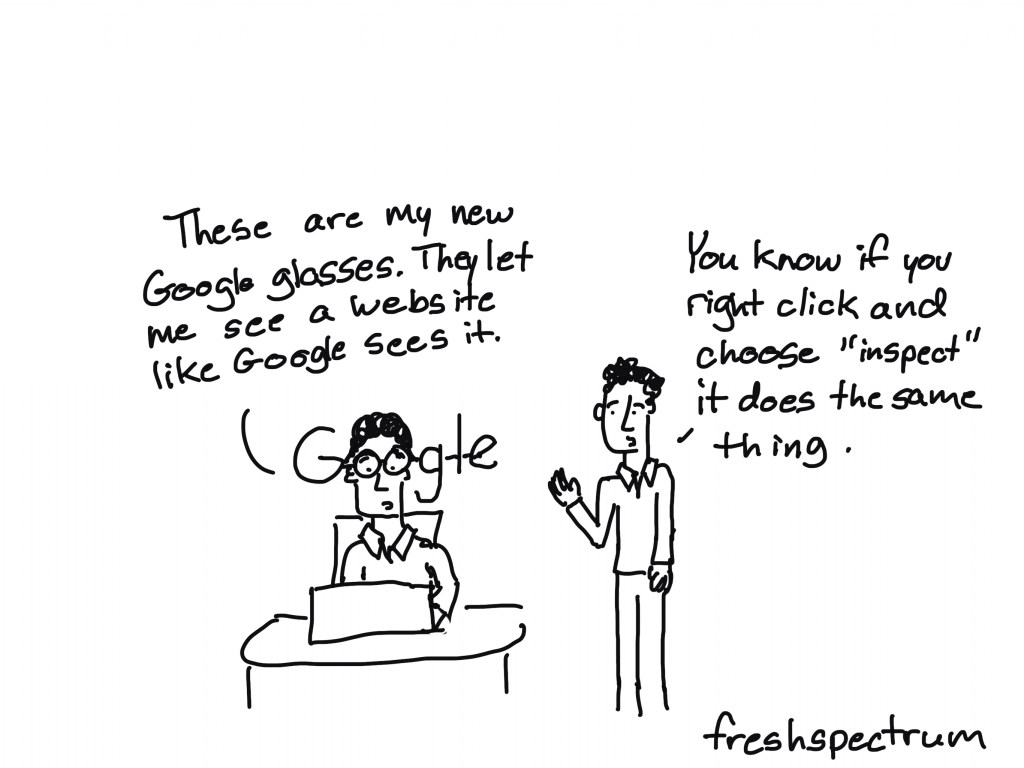
Not exactly. Google has gotten really good at crawling the web and indexing web pages. So it’s pretty likely that they can also parse out the information on the page. But that doesn’t mean it won’t cause problems.
The biggest issue is that if you just plop an embedded dashboard onto your web page, your dashboard content is less likely to show up high in Google search. It’s fine if you don’t care whether people find your dashboard when they Google. But if you want to reach a public audience, you need to compensate.
If you do plan to use rich media on your site, here are some recommendations that can help prevent problems.
Try to use rich media only where it is needed. We recommend that you use HTML for content and navigation.
Provide text versions of pages. If you use a non-HTML splash screen on the home page, make sure to include a regular HTML link on that front page to a text-based page where a user (or Googlebot) can navigate throughout your site without the need for rich media.
In general, search engines are text based. This means that in order to be crawled and indexed, your content needs to be in text format.
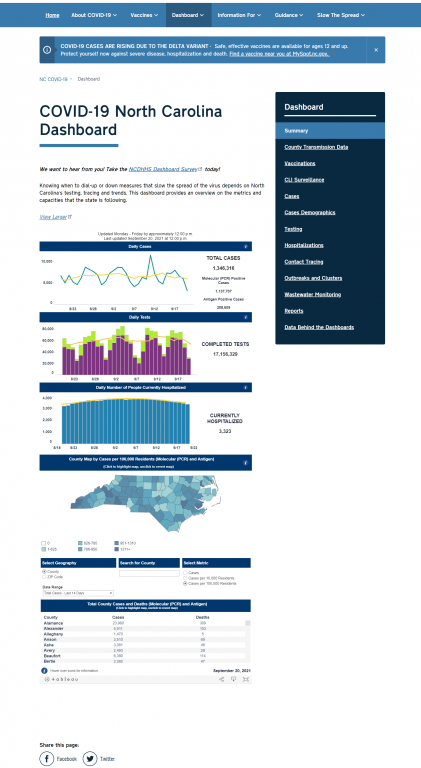
For Example. Let’s look at North Carolina’s COVID-19 dashboard.
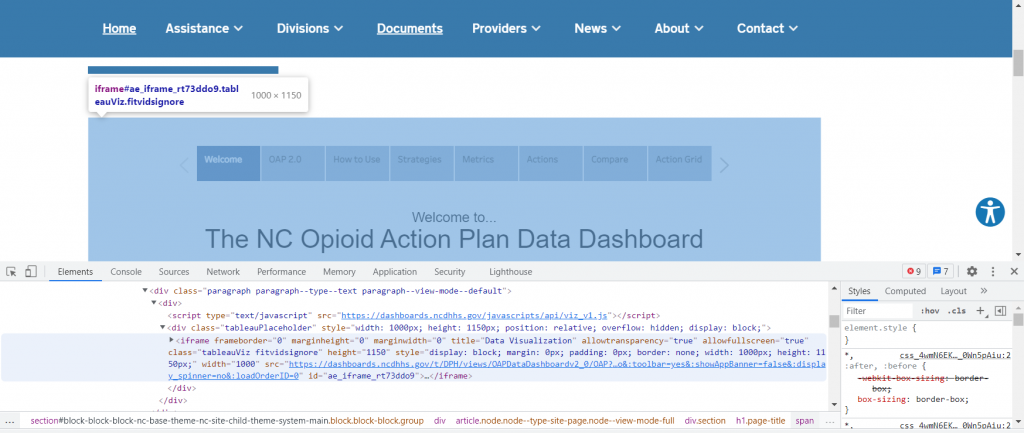
When I see the page, this is what I see.
Behind the dashboard I see, in the code, I find an iframe link.
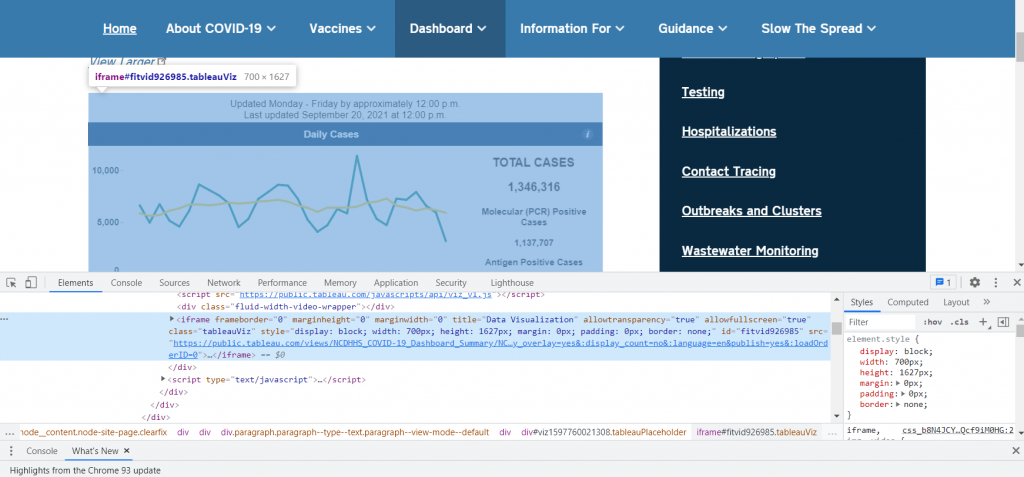
IFrames are sometimes used to display content on web pages. Content displayed via iFrames may not be indexed and available to appear in Google’s search results. We recommend that you avoid the use of iFrames to display content. If you do include iFrames, make sure to provide additional text-based links to the content they display, so that Googlebot can crawl and index this content.
Here, on this page, Google is most likely indexing the lead in paragraph and the header. But not really the data.
But here is the positive with this example, NC’s “COVID dashboard” is an entire subdomain website. It’s not just a page with an embedded Tableau dashboard. So this produces a lot of text for Google to index. Subsequently, the dashboard ranks high in search rankings.
For comparison, you can check out another NC Tableau Dashboard. This one with opioid data. Unlike the previous example, the Opioid Action Plan Data Dashboard has just about all of the text based information embedded within the dashboard.
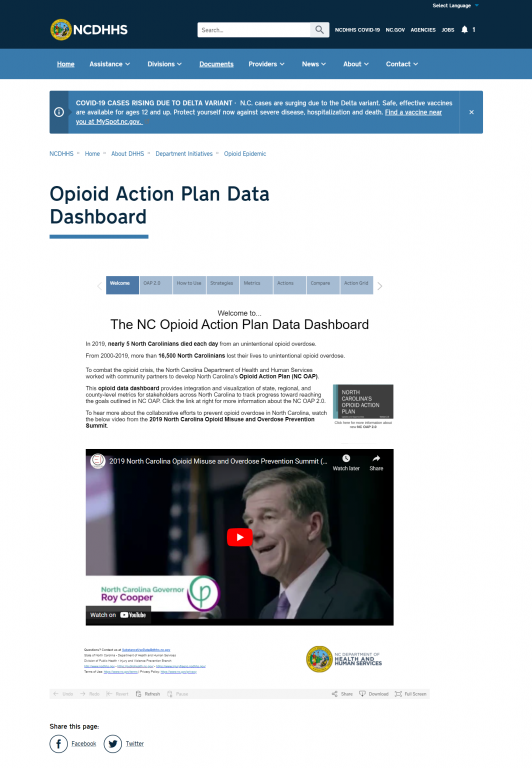
Ultimately, when Google looks at this page. Instead of seeing all that text content, it’s going to just register a few lines of IFrame code.
For the sake of being able to Google this information, all of the text based information (and the tabs) should exist within the websites HTML, not the Tableau dashboard.
Counter Example: NY Times?
So here is the North Carolina COVID Coronavirus Map on NY Times.
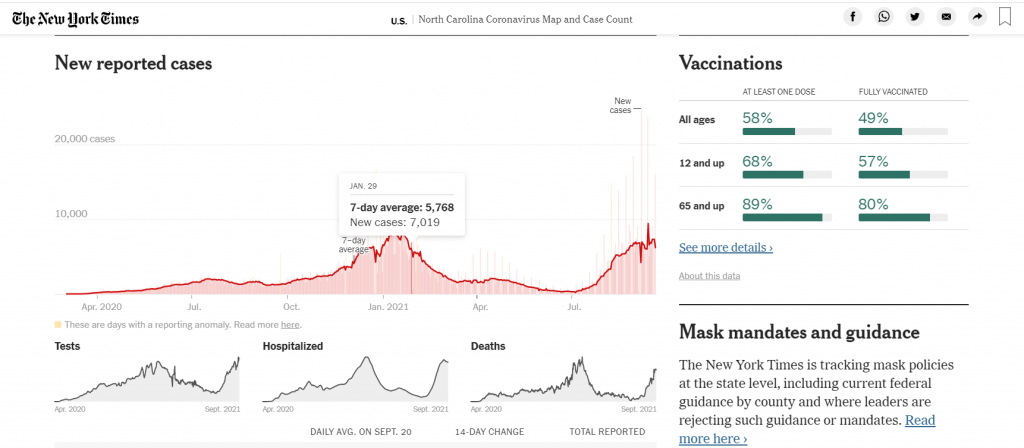
Let’s look at the code underneath the visual.
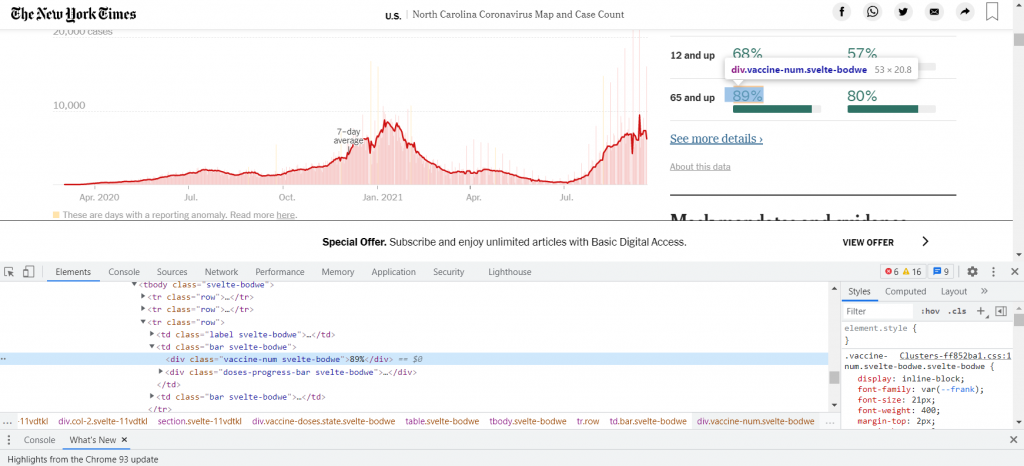
Unlike the last example, everything you see on the page can be found in the code.
If you have ever wondered why Google tends to spotlight data in their search criteria from places like the NY Times and Wikipedia, this is one of the major reasons why. The data crawled, indexed, and visualized on its own terms. This in turn, helps direct people back to places like NY Times and Wikipedia.
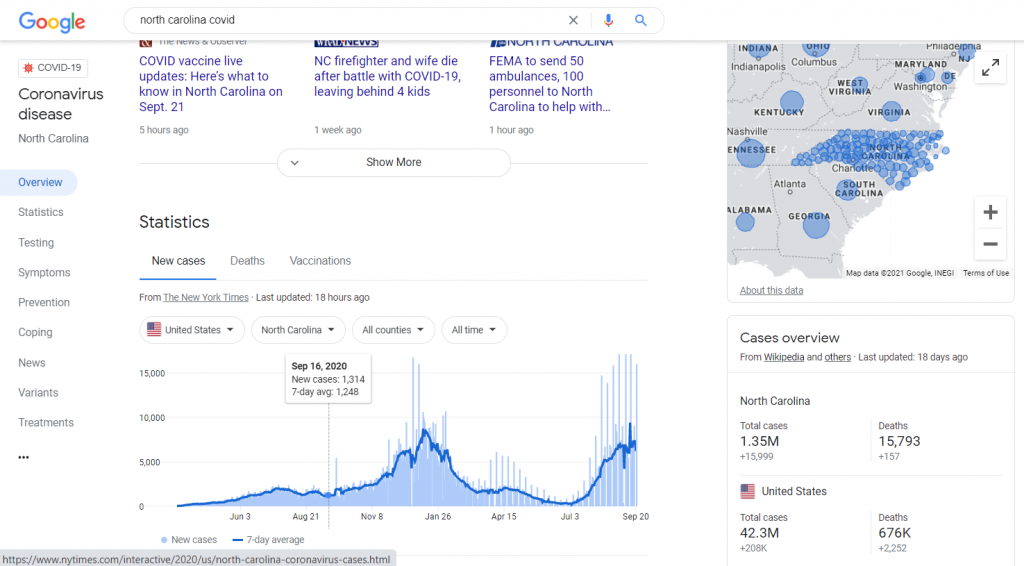
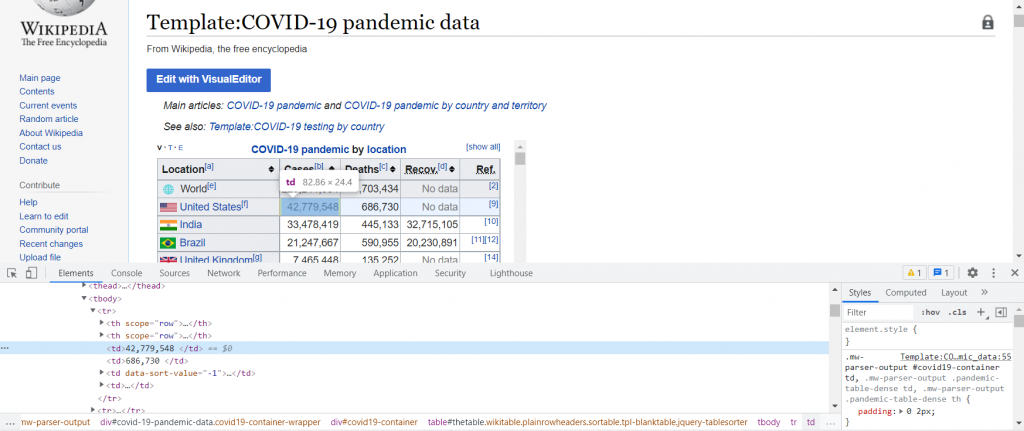
I know, this isn’t Tableau. But this embed thing goes well beyond Tableau.
When sharing information on the web, if we want people to find it, we have to understand what is shared behind what we see.
Bonus Tip: Yes, they are ugly websites, but they are trusted ugly websites

So another question I’ve seen is about domains and dashboards. Should we publish our dashboard under our state or organization domain?
If you work for a state government, federal government, or university you might get annoyed by your website. But even the ugliest of websites fare pretty well in Google, because these sites have a lot of authority.
So when faced with a decision of whether to put your public data dashboard up on an established organization/government public facing website versus sharing on a new domain, generally use the established site. Even if that means a few more bureaucratic hurdles, it’s going to give you the best chance of your content being found.
So, how do we embed Tableau dashboards then?
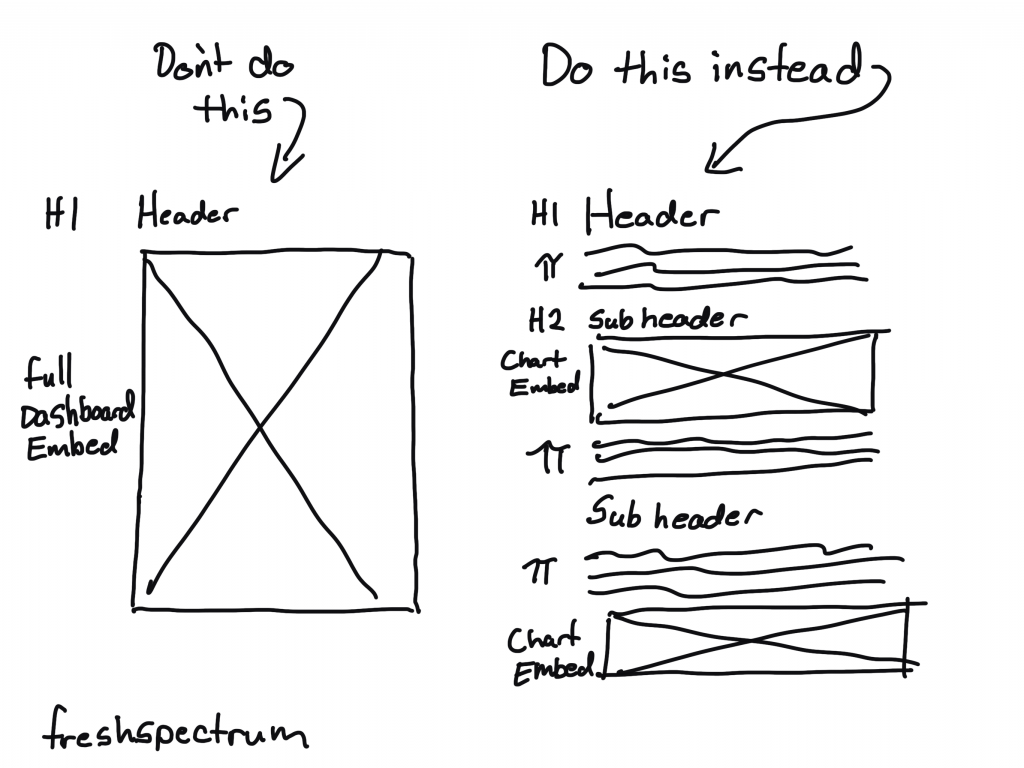
Okay, here is the short answer.
If it is going to be public and on your website, stop thinking about your dashboard as a “Tableau dashboard.” Instead, think of it as a dashboard on your website that you created with the help of Tableau.
Put as much as possible into the HTML on your web page. And if that means creating multiple sub-pages using HTML, do that. Google is going to see it better, and connect it with you if it lives directly on your website.
Then embed the interactive charts/views intermixed with the text based HTML content.
Still Confused?

It can get confusing. That’s why I run a workshop and hold Q&A portions with every session. Click here to join us and get $100 off the annual workshop cost.