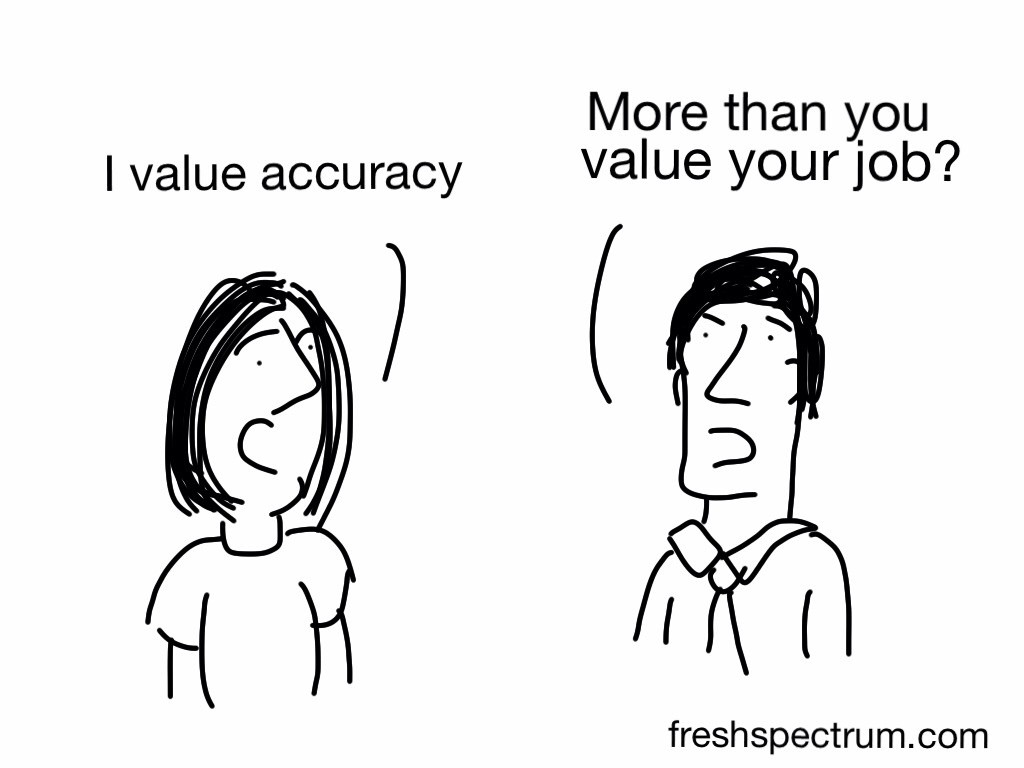
This is an Eval Central archive copy, find the original at freshspectrum.com.
I’m sick this week, so instead of writing something new, I thought I republish something valuable from 11 years ago. This cartoon was inspired through a conversation with my good friend Ann K. Emery.
This was back when Ann was a full time evaluator and before the launch of her super successful training academy and professional development business Depict Data Studio [affiliate link].
All of the comics shared in this post are based on true stories…which is probably why they hold up so well!
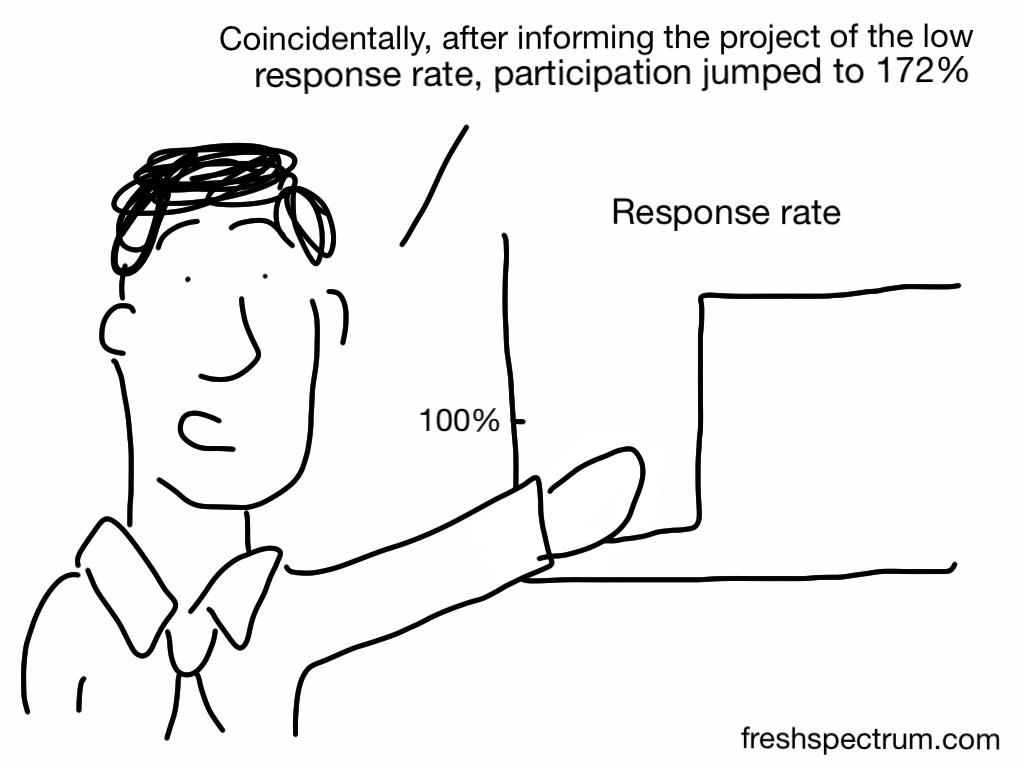
Low Response Rate
Evaluator: “Here are the survey results for your program. The results suggest that _____, but here’s a caveat – there was a low response rate, so we need to take these results with a grain of salt.”
Client: “No problem. Send me the link to the survey. I’ll take the survey a dozen times, and then the response rate will be higher.”
Evaluator: “Sorry, that’s not how it works.”
Client: “Then give me a paper copy of the survey and I’ll make photocopies until we have enough responses.”
Formatting Issue
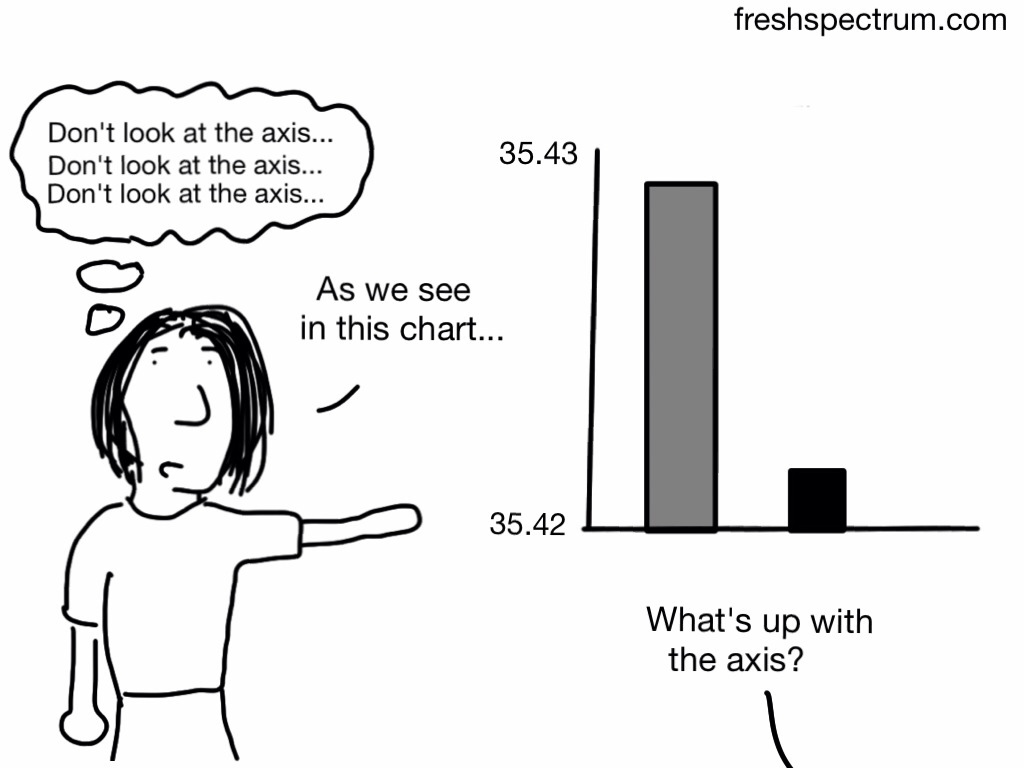
Evaluator: “Here are the results from your program.”
Client: “Uh oh, the results don’t look good. The graphs aren’t going up. Can you re-format the graph to make sure all the bars are going upwards over time?”
Defining Outlier
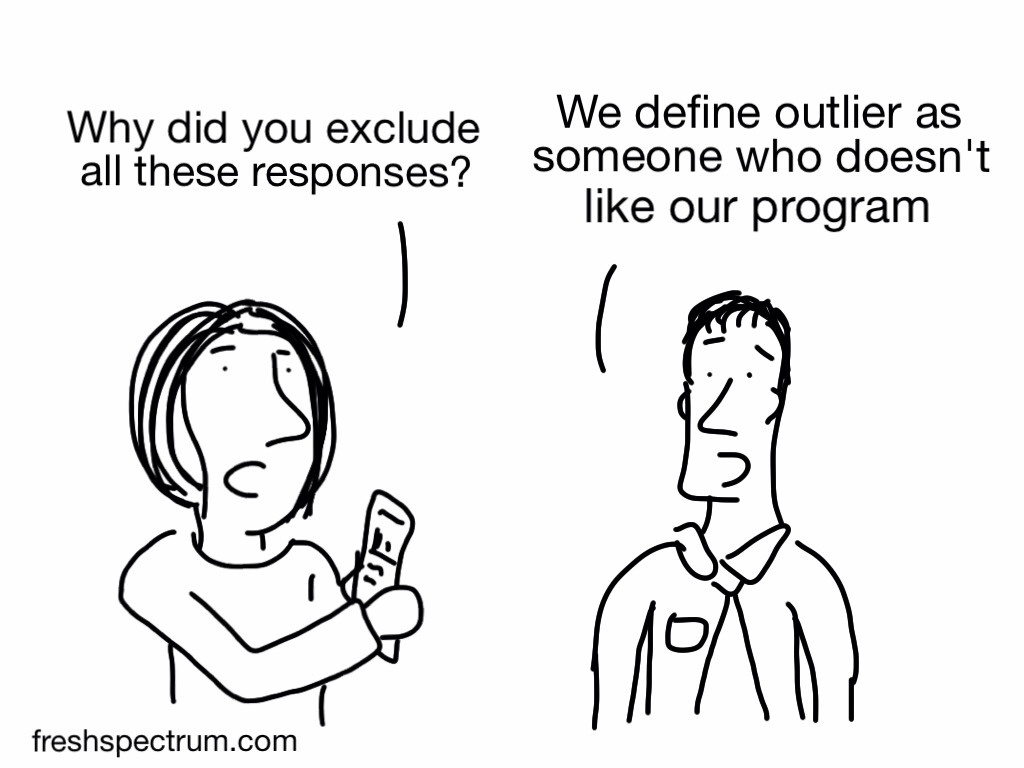
Evaluators: “Here are the results from your program.”
Client: “Those results aren’t accurate.”
Evaluators: “How so?”
Client: “The bad results are obviously outliers. You need to remove those people from the sample.”
Evaluators: “We define an outlier as (1.5 x the interquartile range) below quartile 1 or above quartile 3. Other evaluators define outliers as 3 standard deviations above or below the mean. We checked, and those people are not outliers. In fact, their experience in the program was pretty typical.”
Client: “Sorry, I didn’t realize it was such a hassle to fix. I didn’t mean to create more work for you. Just send me the Word version of your report and I’ll delete that section myself.”
Whoops Typo
Evaluator: “Here are the results.”
Client: “I know our program only had a 38% success rate, but can you type 83% in the report to our funders? 83% sounds better than 38%. If anybody notices, just say you accidentally made a typo.”
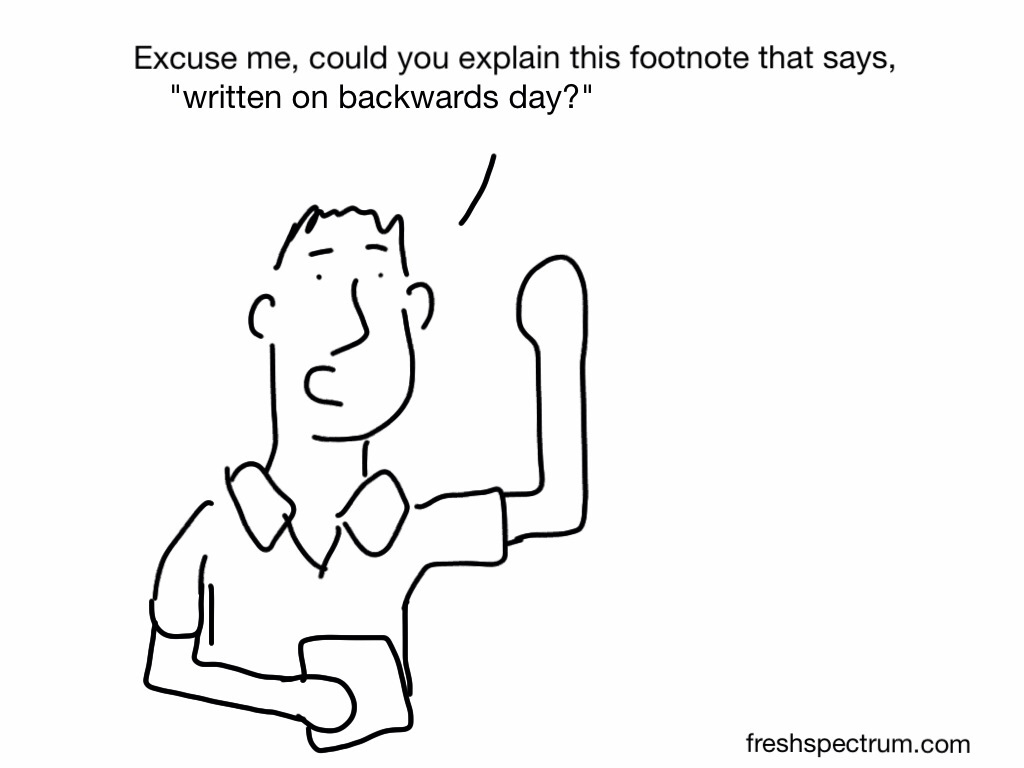
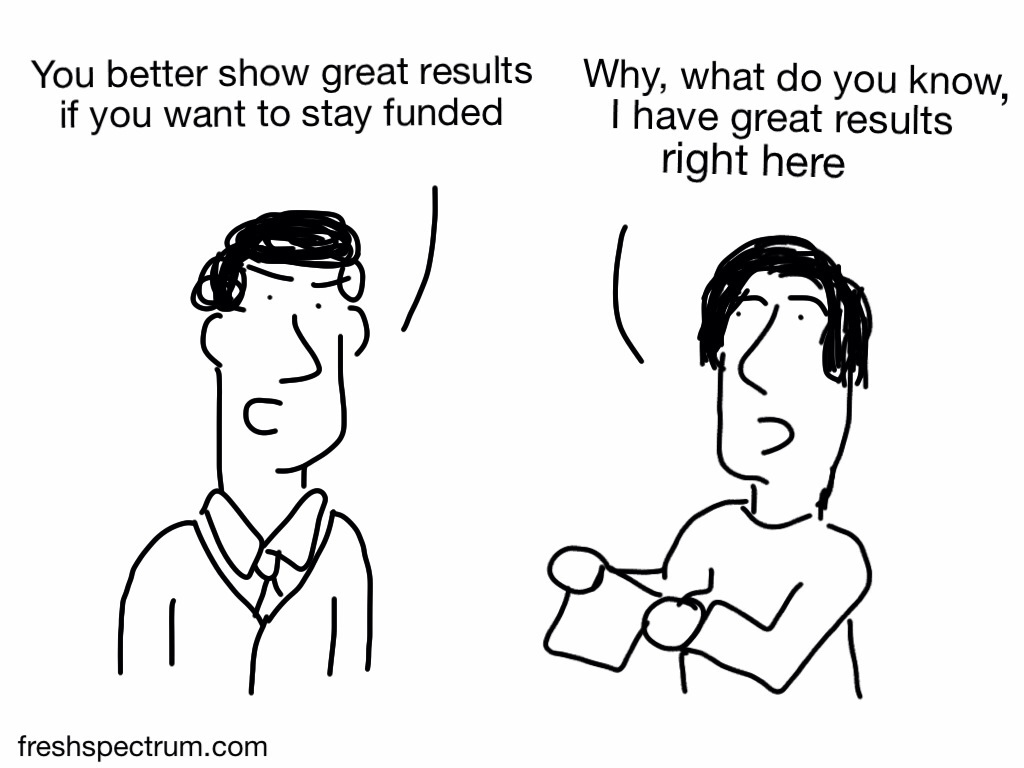
Staying Funded
One more cartoon, just to put the fails in context…
Additional Cartoons
I’m curious, what ethics fails have you witnessed? Anything you can share or would you need the blurry picture and garbled voice treatment too?
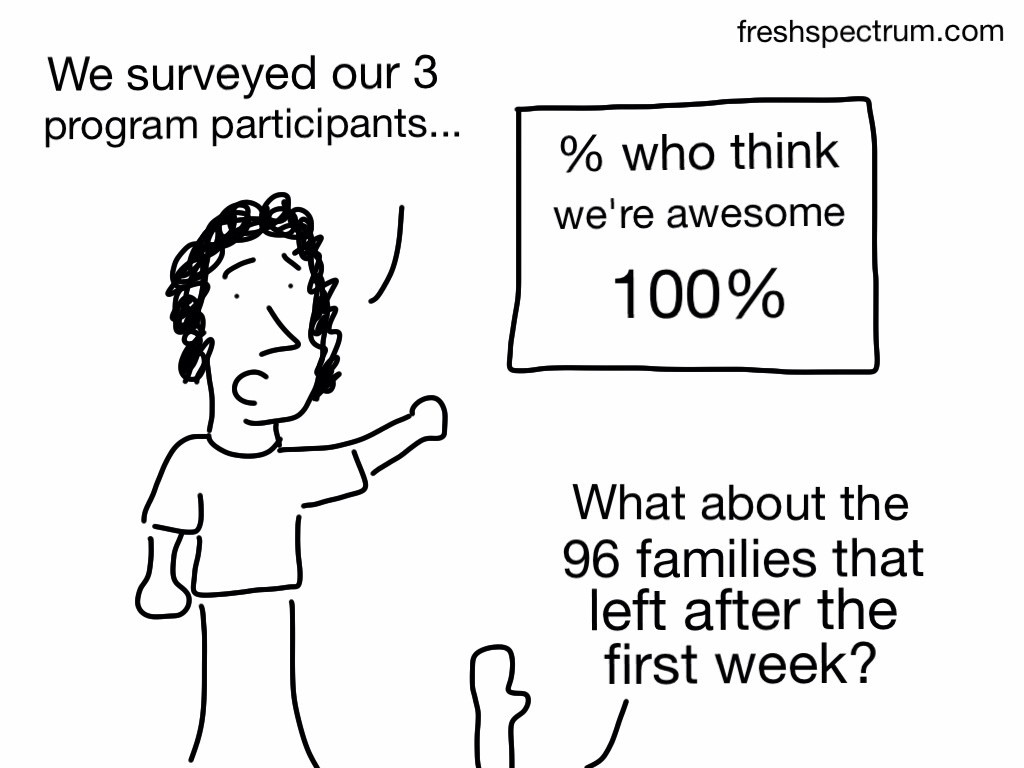
Update 1: Cherry-Picked Sample
Thanks to Maria Gajewski for the comment that inspired this cartoon!
My favorite is the cherry-picked sample. I was involved in a project where directors only wanted to survey students whose families were still involved in the program. It’s not too difficult to figure out families who had a bad experience would not remain with the program, but the directors just couldn’t seem to grasp this when I pointed it out!
Next time, send this cartoon to the directors 
Update 2: Consequences
Ok, here is another comment inspired cartoon (thanks bridgetjones52). And a big thank you to everyone else for all the comments and shares!
When presenting results of evaluation, very very senior manager ‘informed’ us that there would be consequences!!!
