This is an Eval Central archive copy, find the original at freshspectrum.com.
In this post I am going to show you how to edit a vector based PDF graph. You’ll also learn why you might need to so such a thing and how to discover if your PDF graph is indeed vector based.
In this post:
- First, a little data backstory
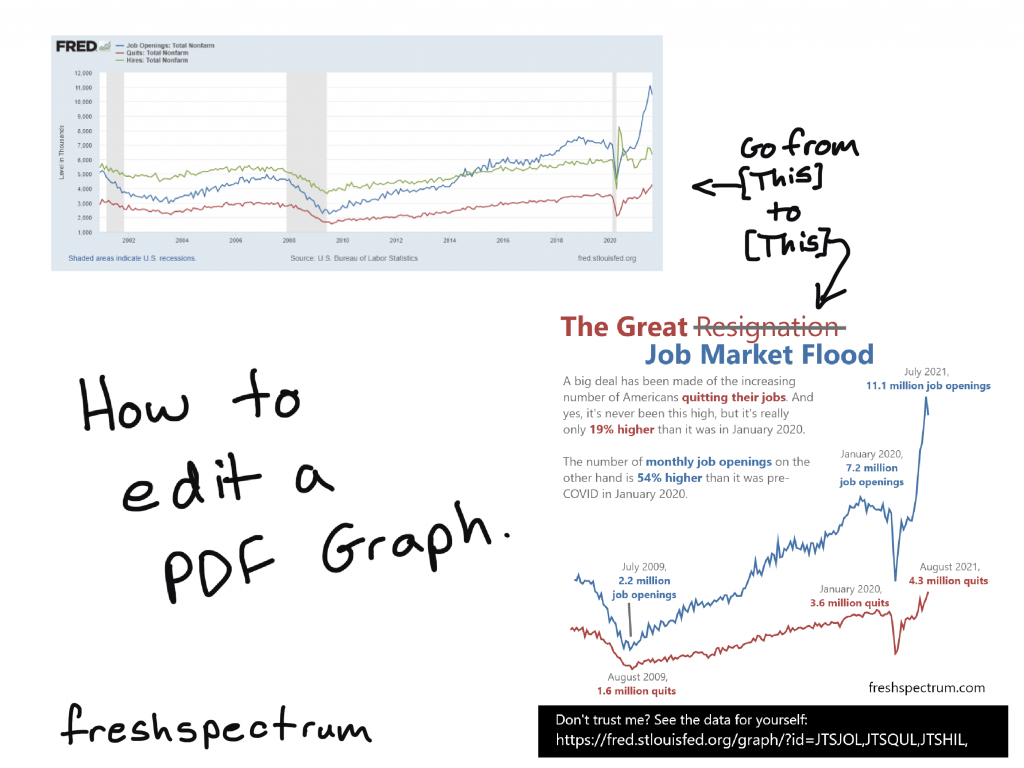
- How I turned this graph…
- …into this infographic.
- A PDF is a sometimes Vector.
- How to Check if a PDF Graph is Vector (aka editable).
- Editing the PDF Graph with Adobe Acrobat Pro.
- Turning the PDF Graph into an Infographic with Adobe XD.
- [Alternative for Non-Creative Cloud Subscribers] Editing the PDF Graph with Inkscape.
First, a little data backstory
Goodbye. Farewell. Adios. Sayonara. Workers have been giving their bosses an earful of such words as of late. Last week, the U.S. Bureau of Labor Statistics announced that 4.3 million Americans, or 2.9% of the entire workforce, quit their jobs in August. That was a record-breaking month, piggybacking on previous record months. “The Great Resignation” is real, and it can be seen across virtually all industries.
It’s late October 2021 and I keep this story headline talking about the “The Great Resignation.” The stories mention 4.3 million Americans quitting their jobs in August, an all time high. When you click the link to follow the data, you find a news release and then a table without a ton of extra context.
This has been a weird time for economic data. COVID19 put a dent in any of the regular metrics making the pandemic stick out in a way that’s completely unavoidable. My curiosity led to a dive into the data. I found a new data source that gave wider picture based on the same datasets.
And the need to convert and edit a PDF chart brought me to this post.
How I turned this graph…
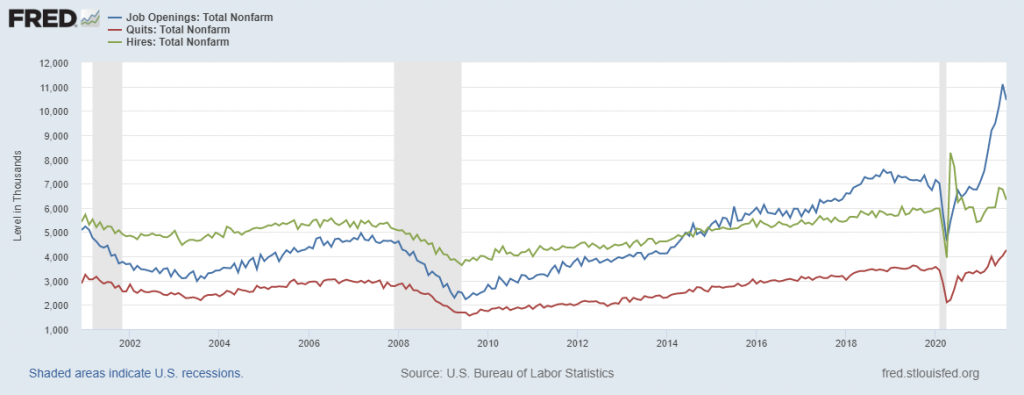
If you look at this chart: the red line is quits, the blue line is job openings, and the green line is hires. It tells a little different story than what we see from “The Great Resignation.” The source of this chart is FRED (Short for Federal Reserve Economic Data). I wanted to clean it up a bit; add focus, put in annotations, and create a social media friendly infographic.
…into this infographic.

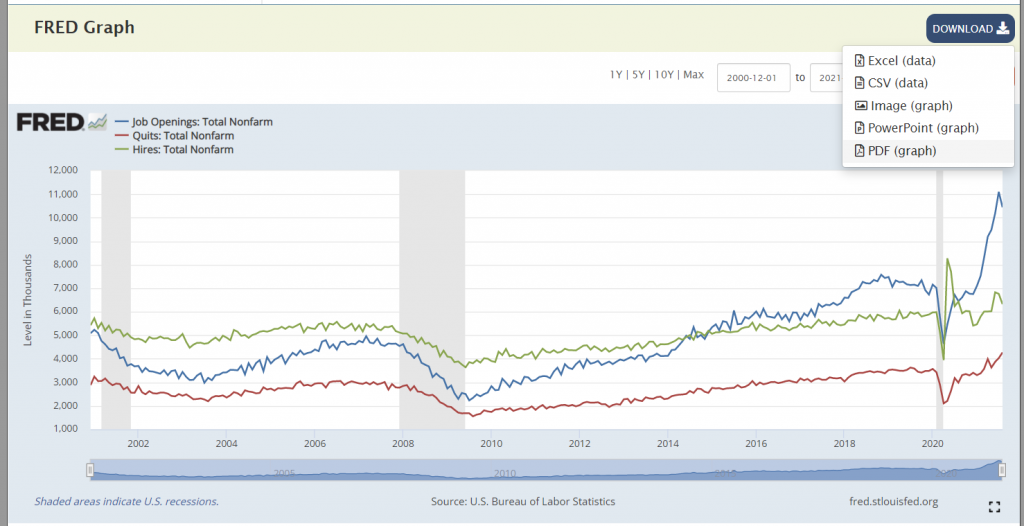
To create this square infographic I didn’t have to recreate the line graph. I just used the one provided by FRED. At the top of the chart there was a “DOWNLOAD” button.
As a designer I would have loved to see “SVG” as one of the download options. The “Image (graph)” downloads a PNG file (which is not Vector and not so flexible to edit). The “PowerPoint (graph)” option downloads a PowerPoint file that includes a slide with the chart (but that chart is also not vector).
That leaves the “PDF (graph)” option, which did happen to be a vector file (woohoo)!
A PDF is a sometimes vector.
So a PDF is a bit of a wildcard file type.
Sometimes with a PDF you’ll be able edit every single element (words, numbers, tables, charts, and colors). Other times it’s really just a static pixel based image file (more similar to a PNG or JPG). But that makes sense, because you can turn just about any picture or text file into a PDF.
As a designer looking to tweak a graph, when I pull open a PDF I really hope to find a vector format.
How to Check if a PDF Graph is Vector (aka editable)
You can find out if a PDF is vector based pretty quickly. All you have to do is Zoom in on the file.
As you Zoom, if the image pixelates (turns into little squares) then your graph is not Vector based. Which basically means it’s easily editable. You’ll have to either recreate using the data, edit in an image editing tool (like photoshop), or recreate using some other approach.
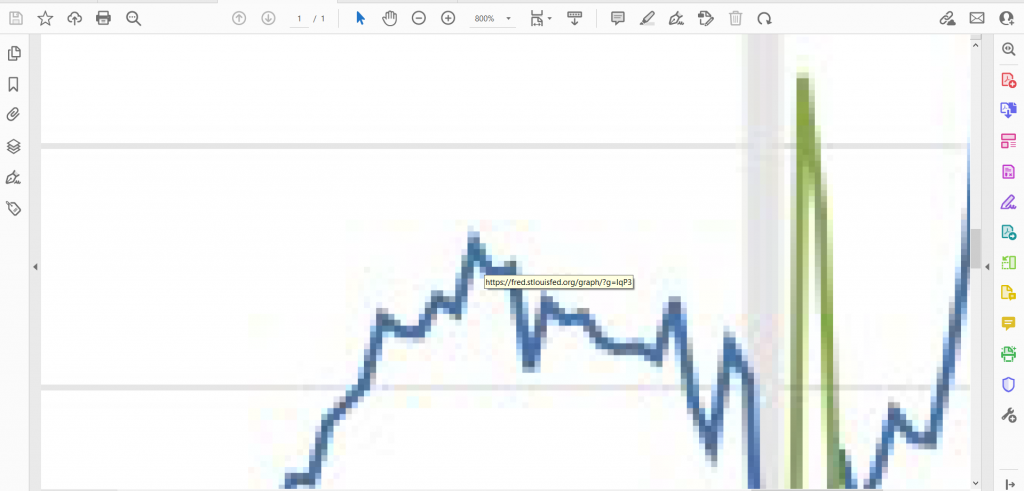
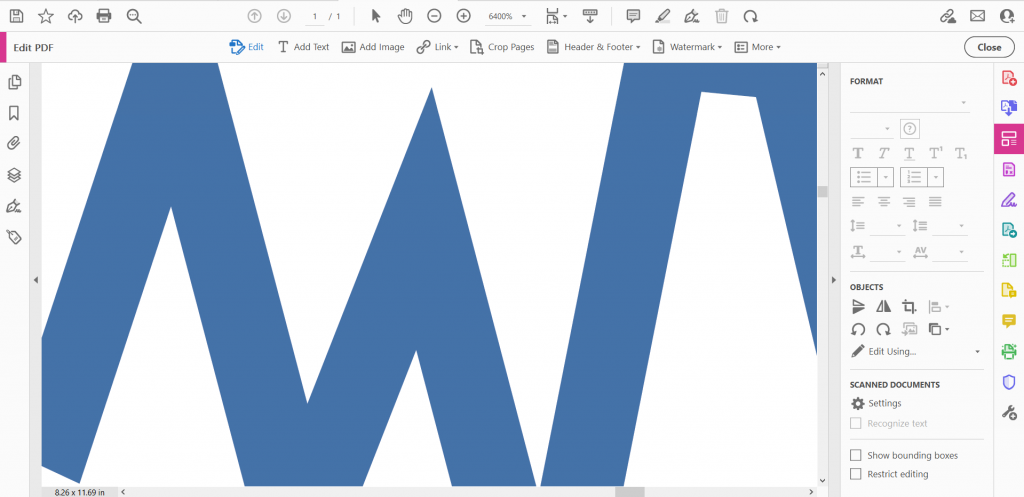
If you can Zoom in and not lose any image quality, the image is Vector. This will give you a lot more options as a designer.
Editing the PDF Graph with Adobe Acrobat Pro
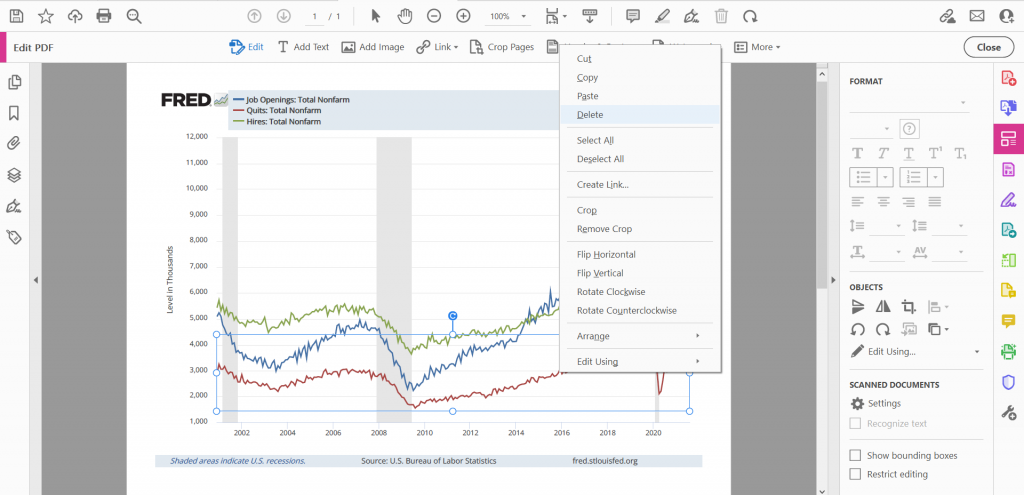
So if you have Adobe Acrobat Pro, you can do some basic editing. This includes editing words on the page, deleting certain formatting blocks, and even deleting or adjusting certain elements in a graph.
Keep in mind that PDF Vectors, especially auto-generated PDF vectors, are not always the cleanest files. There can be empty transparent blocks on top of your graph that you’ll need to delete to get to the chart elements underneath. You are also pretty limited in what you can do.
Editing the PDF Graph with Adobe Illustrator
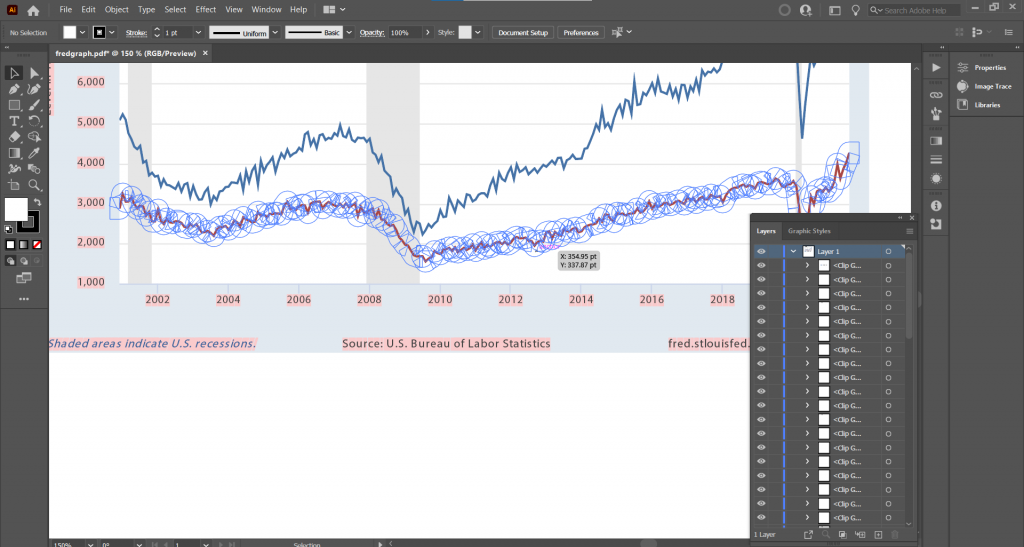
If you have Adobe Creative Cloud, Adobe Illustrator is definitely the tool you will want to use to open up Vector PDFs. You’ll be able to see every single layer and element that makes up the image.
I’ll use Illustrator to open PDFs even when I plan to design my infographics using other tools. To identify an specific element just keep clicking on it until the specific layer is isolated. If you’re an accomplished user of Illustrator you can do all of your editing here.
Turning the PDF Graph into an Infographic with Adobe XD
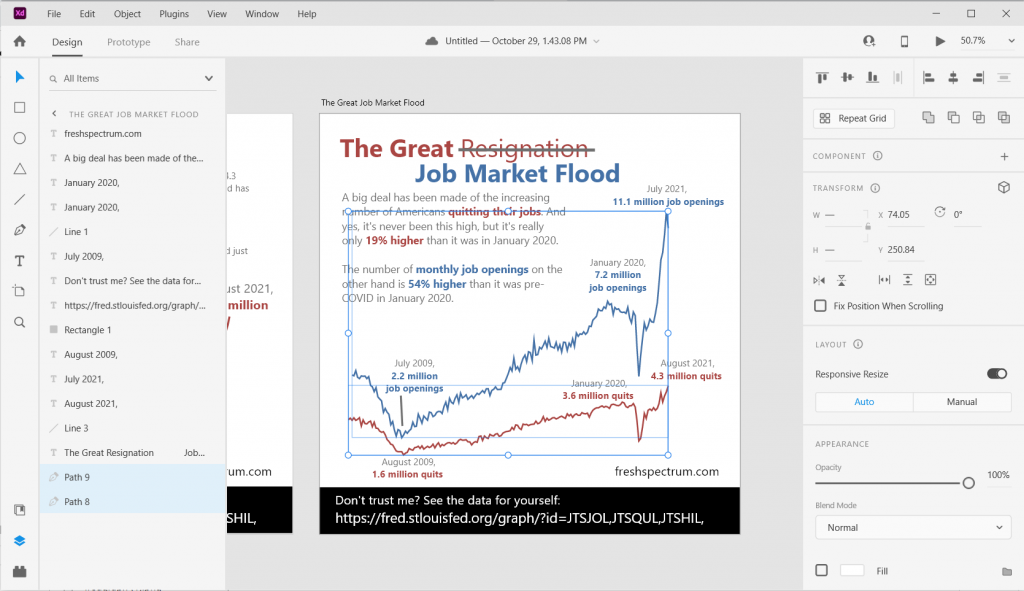
Over the last few years, Adobe XD has become my infographic design tool of choice. While you can drop SVG files right into Adobe XD, you can’t open a PDF. Even if it’s vector.
But what you can do is copy elements right from Adobe Illustrator and paste them into Adobe XD. That’s what I did here, copying the the two lines (each one is it’s own path) in Illustrator and pasting them into my XD file. Now I can do a lot with them, including changing colors and changing each line’s thickness.
[Alternative for Non-Creative Cloud Subscribers] Editing the PDF Graph with Inkscape
So I know there are a lot of you who do not have, and will likely never have, a subscription to Adobe Creative Cloud. That’s okay, you can still edit PDF graphs.
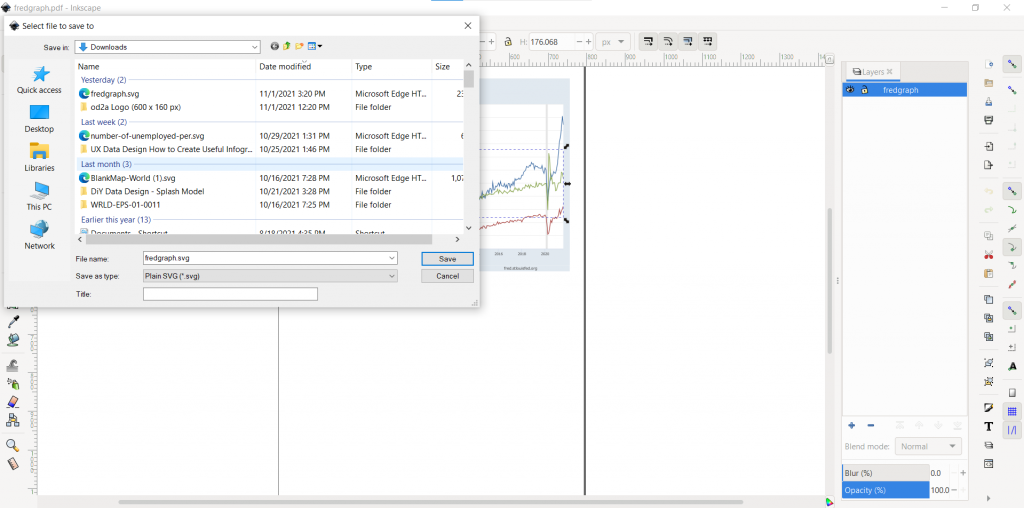
There is an open source vector drawing tool called Inkscape. And with Inkscape you can do a lot of the same things you could do in Illustrator (including opening up a PDF). Still want to use Adobe XD to create your infographic? That’s no problem, just save your file as an SVG. Then drop the SVG into Adobe XD.
