This is an Eval Central archive copy, find the original at engagewithdata.com.
Reframing data analysis as meaning-making
This summer on the Engage with Data blog, I’m exploring different ways to answer the question: “So what?”
My goal is to remind us of the human element of data — we are in the field of student and family engagement, after all!
But I do get it – data analysis can be a pretty technical and sometimes overwhelming to educators who haven’t been formally trained in using it.
I want to help you see that 1) technical doesn’t have to be scary, and 2) even if you hated your stats in college, you can be successful in collecting, analyzing, and using data to guide your work with kids and families.
So let’s remind ourselves about WHY we ultimately use data.
It’s not to simply check a box or satisfy some compliance measure.
We really use data to:
– understand the needs of the people we serve and how well we are or aren’t meeting them.
– make meaning of the experiences our colleagues and stakeholders are having and to find ways to make those experiences even better for all involved.
– discern our impact on the people and communities we truly care about.
When you get overwhelmed by those report requests or compliance measures, I challenge you to think about each row in your spreadsheet as the child, family, teacher, or classroom it represents. What does this collection of numbers tell us about them?
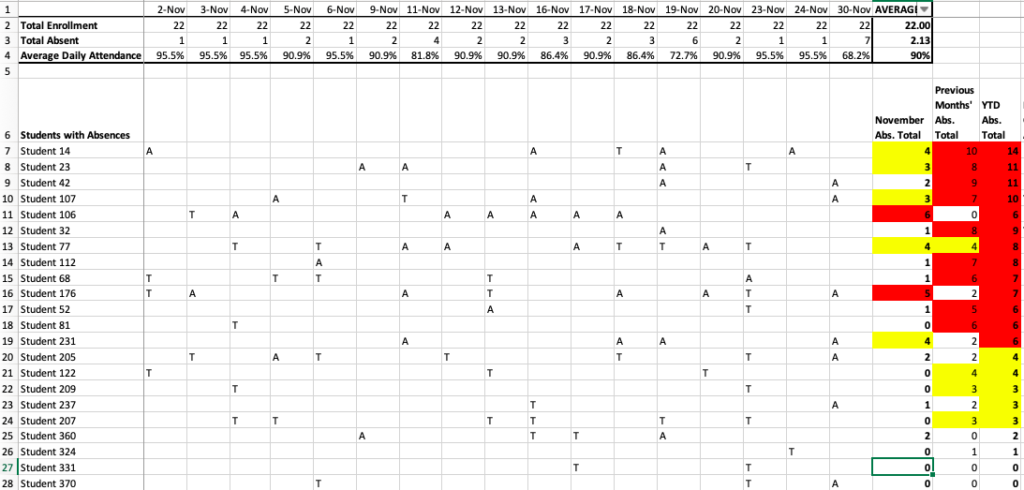
Let’s look at some sample data to practice finding meaning in it. Take a look at the attendance data for the fictional Ms. Hoffman’s first-grade class below.

At first glance, the conditional formatting that I used shows me that there are quite a few students who have missed more than five days by November of this school year — a warning that I need to do some kind of attendance intervention, like a letter, phone call or meeting.
We can also start to think about what might be happening in Ms. Hoffman’s class — are the students excited about learning? Do they feel safe there? Is she engaging their families regularly?
We can also consider what outside influences may impact this particular group of students — did they struggle with attendance in previous years? Are there other barriers, such as transportation or having enough school uniforms, that might get in the way of them getting to school?
Now let’s go a little deeper.

We can look at both the individual and class levels to try to figure out what’s happening with the attendance in Ms. Hoffman’s class and what to do about it.
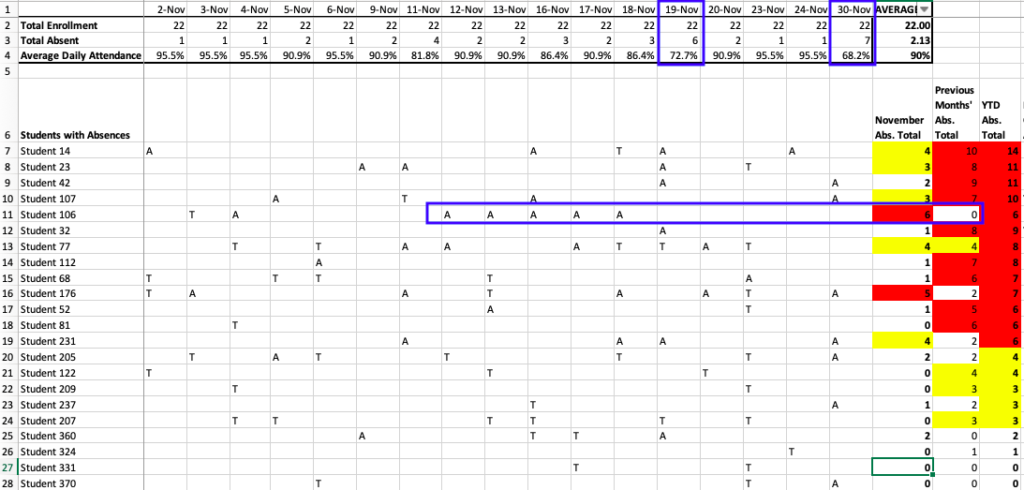
First, take a look at the student record in the blue box above.
This student hadn’t missed a single day of school in previous months and then missed five in a row!
(Hopefully the student is just on a pre-Thanksgiving vacation, but we certainly want to know if there’s something more concerning or preventable going on.)
Looking at student-level patterns can show us that something is clearly going on here that we need to learn more about through authentic family engagement.
We can also look at anomalies — in this case, the days in which the class average daily attendance is way below the monthly average.
Look at the two dates highlighted in the blue boxes. These attendance averages clearly stand out from the other days’ averages and have brought the monthly average down.
It might take some investigating to figure out why attendance was so low those days – did it rain or snow? Was there an early release day? The 30th may even have been the day after Thanksgiving break when families are still traveling.
Noting these anomalies helps us see things that our averages and totals don’t tell us and help us troubleshoot how to prevent similar trends in the future.
By thinking about the human aspects of our data — what is happening to the people those spreadsheet rows represent — we can start to make meaning of the data we collect and position ourselves to positively impact their experiences and lives.