This is an Eval Central archive copy, find the original at evalacademy.com.
We’ve all been there – you get some data from a client or a survey you’ve run, and you can’t wait to start answering your evaluation questions. But you find one of your data columns is a complete mess because it was an open-ended text field. Maybe you asked respondents to enter their province, job title, or favourite Halloween candy. And they answered your question, but everyone spelled things a little bit differently, some capitalized each word, others used all caps, some included their town and province, others entered the abbreviation for their province. The list of ways your open-ended text fields can become messy goes on and on.
Now, when you want to analyze the data from that text column you need to go through and clean the data so that everything is consistent. This can be a day-ruining, brain-melting task, especially if you have to go through and clean up hundreds or even thousands of data points. But this doesn’t have to ruin your day – I’m going to show you how to use OpenRefine to make this task a million times easier. And because it’s October, we’re going to talk about Halloween candy!

What is OpenRefine?
OpenRefine is a free, open-source program designed for data cleaning and transformation (a.k.a. “data wrangling”). It has many features, which you can learn about on their website, but for this tutorial we will focus on using it to clean the kinds of messy, inconsistent text data I mentioned above. This data might come from a survey with an open text field, or perhaps administrative data being entered by program staff. Whatever the source, it needs to be cleaned and standardized before you can do any kind of summarizing.

The Messy Survey Data
Picture it: October, 2019. It’s a regular year and you’re getting ready for trick or treaters to come knocking. But this year, you want to make sure you are giving out the best candy in the neighbourhood. Like any good evaluator, you decide to conduct a survey asking people which candy brings them the most joy – that way, you can be sure to stock up on everyone’s favourites.
When your survey is complete, some of the responses to “What Halloween candy brings you joy?” look something like this:
-
Little Debbie snack cakes.
-
Little Debbie snacks.
-
Little shot bottles of booze
-
Pay day, sweettart ropes, mentos
-
Payday
-
Payday Bar
-
Payday bar, Ferrero Rocher,
-
PayDay Bars
Of course, with any large survey you’re bound to get some jokesters (like little bottles of booze)! But more importantly, how are we going to know how many people want Payday when it’s all spelled differently? Excel won’t be able to recognize them as the same chocolate bar to add up. Let’s download OpenRefine so we can fix this.
If you’d like to follow along, download the 2017 Candy Hierarchy data here (credit to the University of British Columbia).
Step 1: Import data to OpenRefine
When you start OpenRefine, it opens in your web browser. Don’t worry, your data won’t be connected to the internet – it is all kept locally on your computer. The web browser is just the interface used to run the program.
Once you’ve launched the program, click Create Project (1), then Get data from… This computer (2). Choose a file, navigate to your spreadsheet of choice (in this case, our candy data), and click Next.

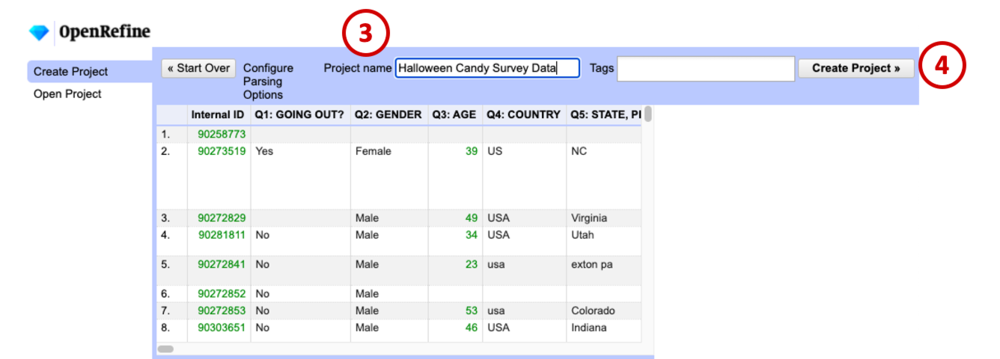
Make sure the data looks right in the preview window, give your project a name (3), and click Create Project (4).
Step 2: Split columns with lists of candy
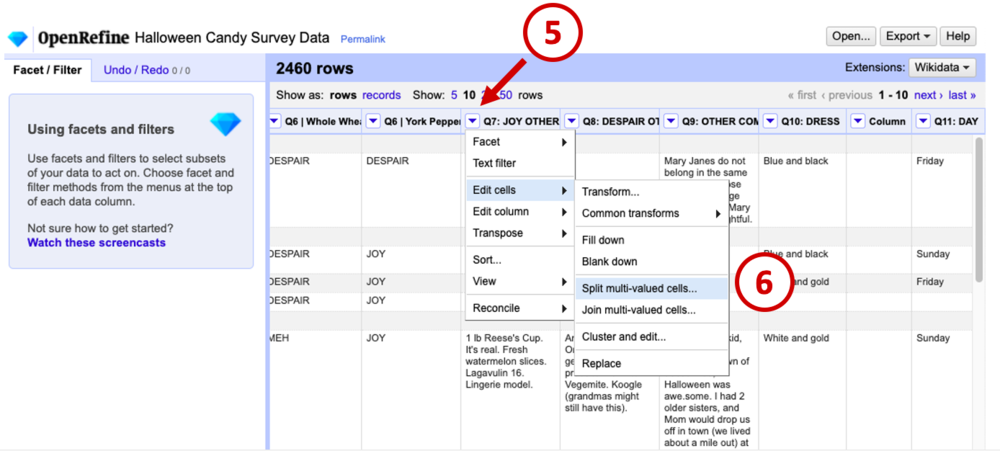
The first transformation we’ll do is split up cells containing more than one candy. For example, we need the computer to recognize “Payday bar, Ferrero Rocher” as 1 vote for Payday, and 1 vote for Ferrero Roche. To do this, navigate to the relevant column in your data (in our example it’s Q7), click the down arrow on the column header to open the menu (5), select Edit cell, then Split multi-valued cells… (6).
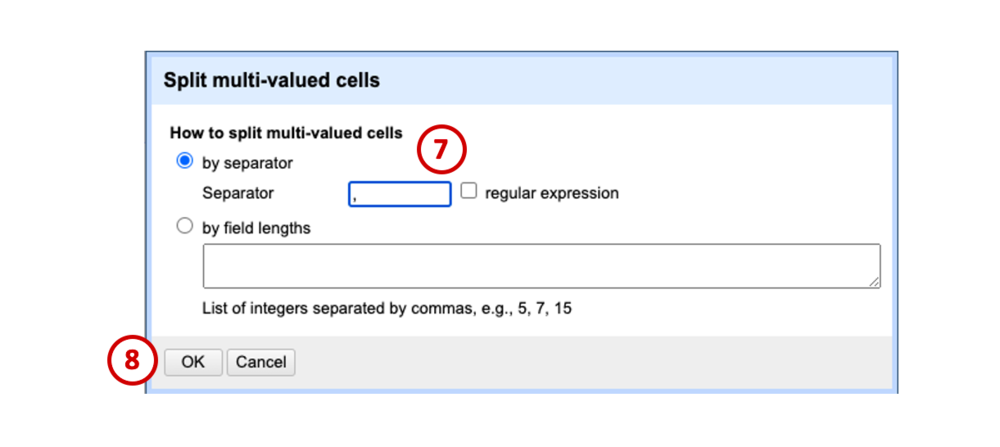
In the dialogue box that appears, leave the default, which is to separate cells by comma (7), and click OK (8). This tells the program “Everywhere you see a comma in this column, split the text into a new cell.”
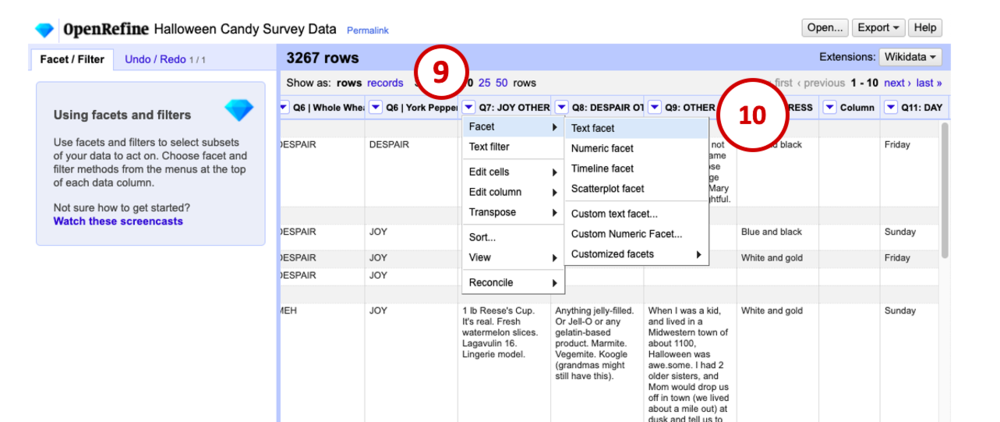
Before we did this, we had 2460 rows, and now we have 3267 rows. This is because each item is now in its own row instead of being listed with commas between. For example, “Payday, Fererro Roche” becomes:
Payday
Ferrero Roche
Step 2: Merge similar candy names together
Now that we have separated lists of candies into individual candies, we can start to clean the text by grouping similar candies together. For example, we need to change pay day, payday, PayDay, and payday bars all to “Payday.” Without OpenRefine, this would be a manual task of searching through the list and fixing them.
OpenRefine can do this automatically using a facet. Facets are like filters that allow you to summarize and clean entire chunks of your data. First, go back to that dropdown menu on the Q7 column (9), choose Facet, then Text facet (10).
The text facet we just created on the Q7 column appears in the panel on the left side of the window. It shows each value of Q7 and how many times it appears. You can see some of the different variations of Payday that people entered, and lots of them show a 1 beside them, meaning only one person entered that exact answer. We’re going to change that though. The cluster button in the facet pane allows us to group together similar responses and rename them as a batch.
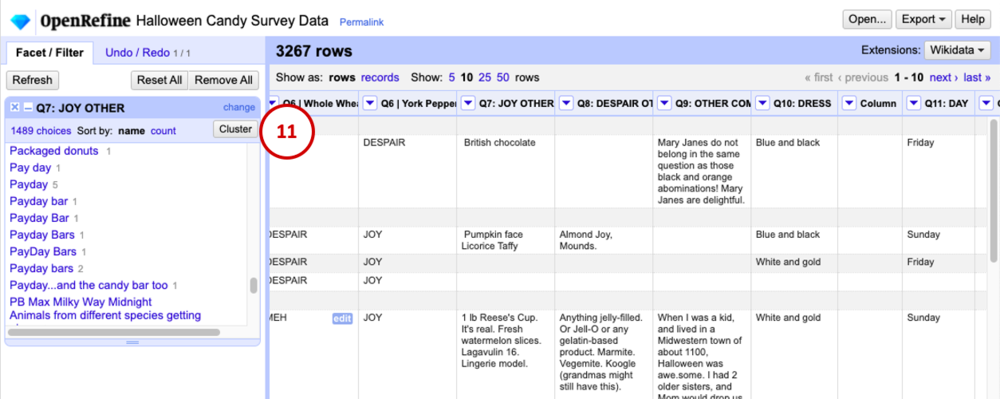
Click Cluster (11). Ta da! This is the part that gets me really excited as a data nerd – the program uses “fuzzy matching” to take a best guess at which pieces of text actually refer to the same thing. You can play with the Method and Keying Function to change the type of algorithm used to fuzzy match – but we’ll leave the defaults for this tutorial.
The Values in Cluster column shows you which values it thinks belong together. The first one looks good, it’s just a bunch of variations on “Almond Joy.” To clean all of these values in the dataset, we will check the box under Merge? (12) and make sure the New Cell Value is correct (13). Now, every item in Values in Cluster will be updated to the New Cell Value.
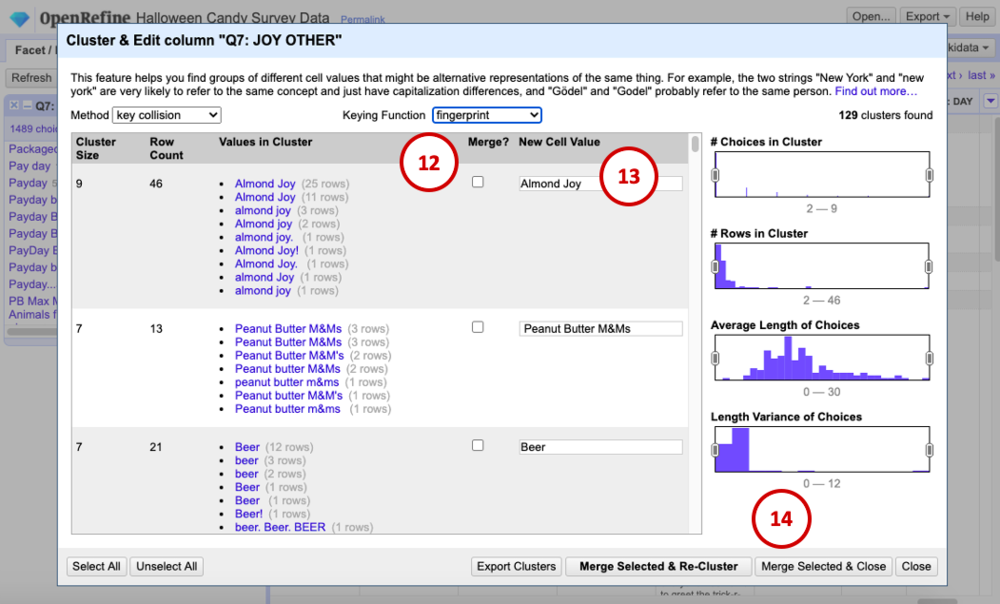
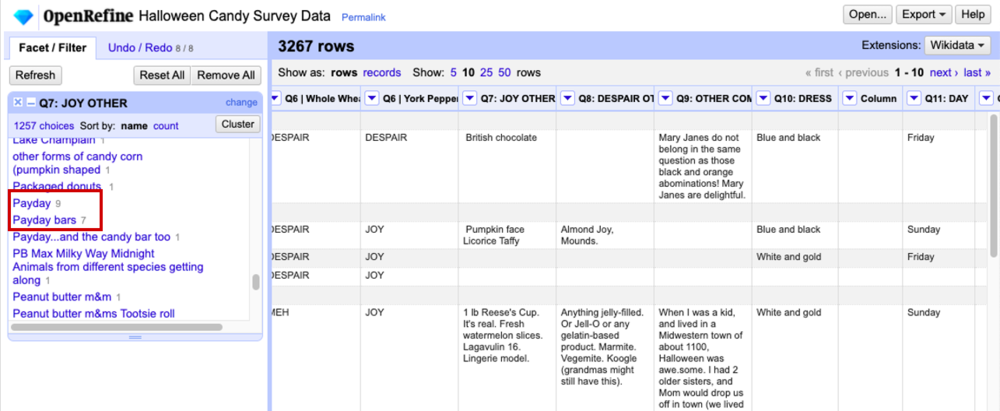
Continue going through the list in the same way, checking the box for clusters you’d like to merge, and when you’re done, click Merge Selected and Close (14). Before we started merging, there were 1489 different values in the Q7 column. Now there are 1257, meaning we were able to automatically clean 232 values from the dataset!
The program does a great job of matching the correct values, but as with anything automated, you should go through and look at your data for any discrepancies. For example, “Payday” now has 9 entries, and “Payday bars” has 7 because the algorithm doesn’t know these two actually refer to the same thing (we would simply manually merge these two categories).
When you are done cleaning, you can export your data back to Excel by clicking the Export button in the top-right, then do a little happy dance for all the time you saved!
Summary
Using OpenRefine, we took some messy (and delicious) Halloween candy survey data, separated the cells by comma, then used fuzzy matching to cluster and rename batches of values. Now we have data that is in much better shape for any final cleaning or analysis.
If you try OpenRefine on your own messy text data, tell us about it on Twitter or the comments below!
Sign up for our newsletter
We’ll let you know about our new content, and curate the best new evaluation resources from around the web!
We respect your privacy.
Thank you!