This is an Eval Central archive copy, find the original at engagewithdata.com.
One positive thing to come out of the pandemic is an increased appetite for online professional development. Recently, I’ve gotten to connect with old friends and colleagues by providing a three-part Excel workshop series for the Family League of Baltimore. So on top of hanging out with my old network, I’ve gotten to teach them about all the fun stuff Excel can do. Win-win!
Here’s an overview of the series:
Part 1: Excel Basics
A lot of educators just haven’t been trained in how to use data. They may be consumers of it, using someone else’s spreadsheet to glean information, but often, they just don’t know how to utilize Excel’s features for themselves. The Excel Basics workshop starts from the top and discusses formatting, functions, and formulas that beginners can use to build their Excel capacity.
Part 2: Creating and Using Templates in Excel
In the engagement world, there is so much to track! This session built on what was covered in the Basics session and walked participants through the process of designing their own customized tracking sheets. We used breakout rooms to discuss how to track different topics, and we walked through some more advanced features and functions to make these tools as automated as possible.
Part 3: Reporting and Visualizing Data in Excel
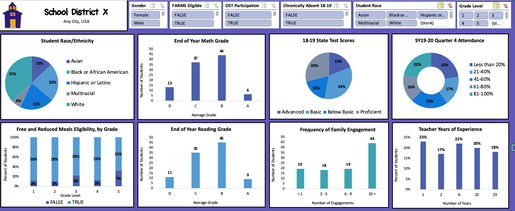
Data visualization is a hot topic in evaluation right now, and I get why. When you’re able to effectively show your data graphically, you can make your results accessible for a much wider audience. In this session, we talked about so many fun parts of Excel – PivotTables, creating charts and tables for reporting, and … drumroll, please … creating interactive dashboards! Did you know you can create dashboards like the one below to share with your team?
- “Practical examples applicable to daily work. Presented at the right pace. Great content.”
- “My approach will be to allow my understanding of the various features to help me work smarter not harder. I am encouraged to continue to use excel, not run away from it.”
- “I feel more aware of how to efficiently organize my data! This will be helpful for reporting, and analyzing data for my own outreach strategies.”
- “I really enjoyed this session. They did a great job reaching participants of many levels.”
Besides my obvious bias towards using Excel for … well, everything … I think it is even more important now for schools and districts to be effectively tracking their work. As we navigate through so many unknowns with school reopening, it will be critical to keep an eye on students who are at risk of falling through the cracks.
Good news – Excel can help (and so can I!).
I’d love to bring this workshop series to more places, so if your team could use a bit of an Excel boost, let’s talk!
