This is an Eval Central archive copy, find the original at freshspectrum.com.
There are several ways to bring Excel Charts into Canva but which way is the right way? In this post I’ll walk you through the options and help you decide the best way for you.
So I had this question from an attendee of one of my data design webinars. “How do I bring Excel charts into Canva with a transparent background? I’ve tried copy and pasting but I end up with a white background.”
This is a pretty common problem, and it’s not just bringing charts into Canva but into other tools too. Luckily there is also a pretty common solution.
Why a simple Copy and Paste gives you an image with a white background.
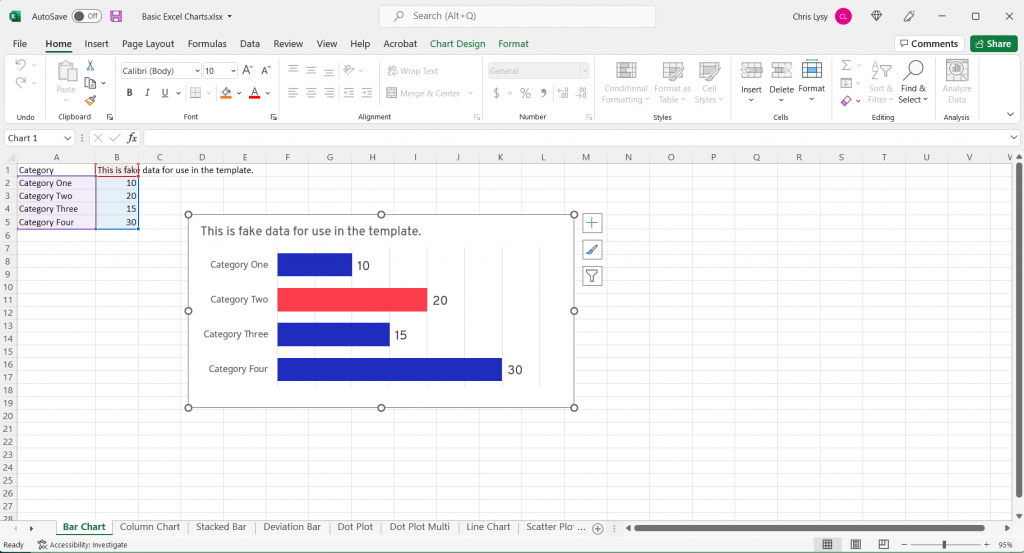
So the easiest way to bring a chart from Excel into another program like Canva is to use Copy/Paste. Just select the chart and COPY (CTRL C), then open a Canva design and PASTE (CTRL V).
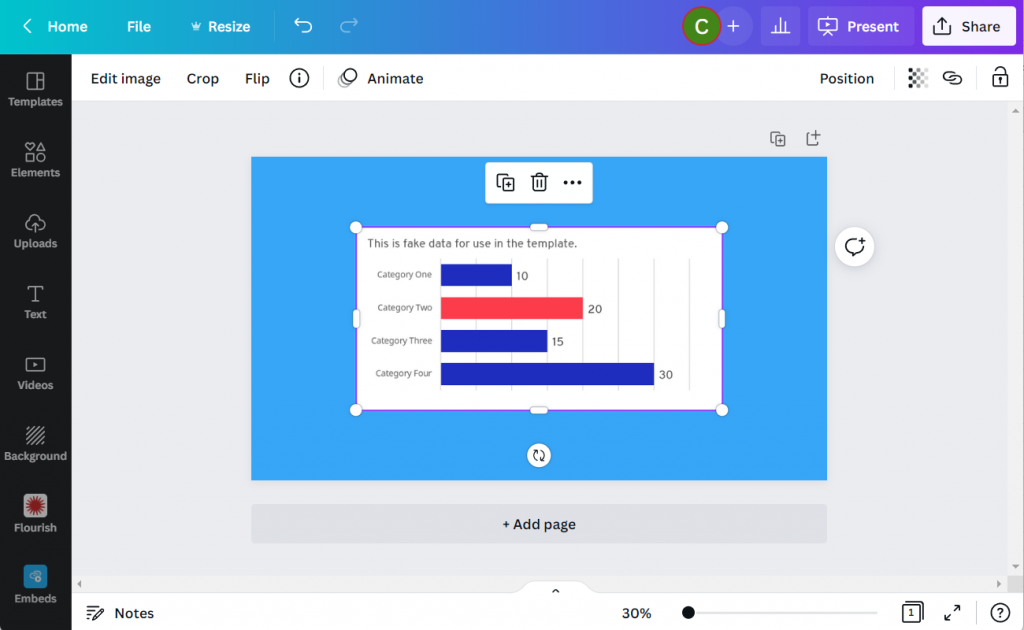
This will work, but two things will likely happen.
- You’ll have a white box behind the chart (meaning you won’t be able to see the background through your chart.
- You’ll probably also have a border around the box.
The first thing you should know though is that this isn’t really a Canva problem. It’s an Excel problem.
When you copy from Excel and paste into Canva, you’ll find a new image file in your Uploads tab. You’ll also notice that the image is a PNG, which is good. Because a PNG “can” give you a transparent background (a JPG will not).
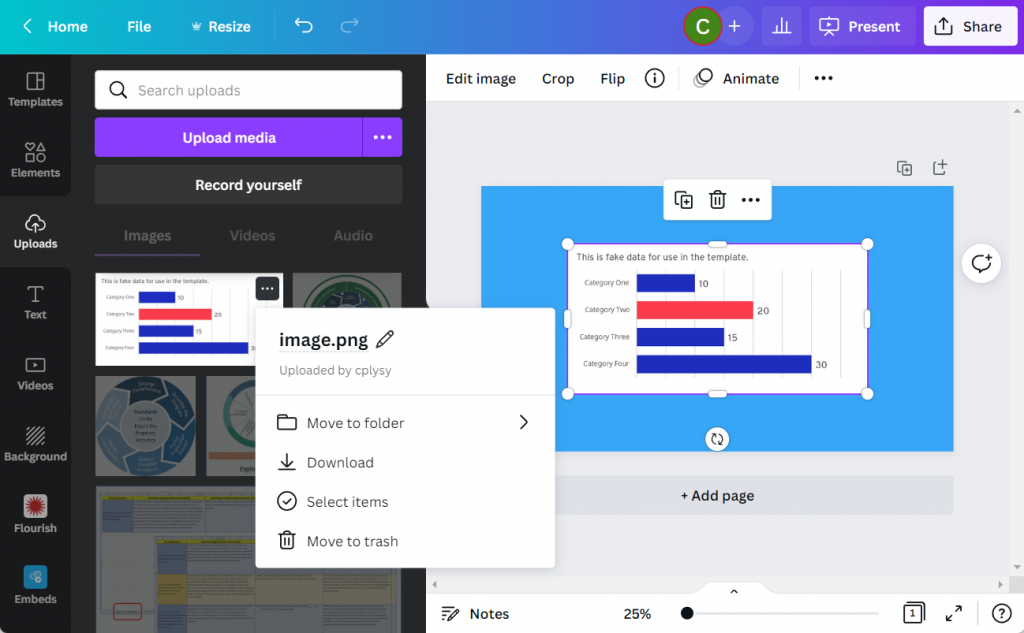
Giving Your Excel Chart a Transparent Background
Let’s go back to our chart in Excel.
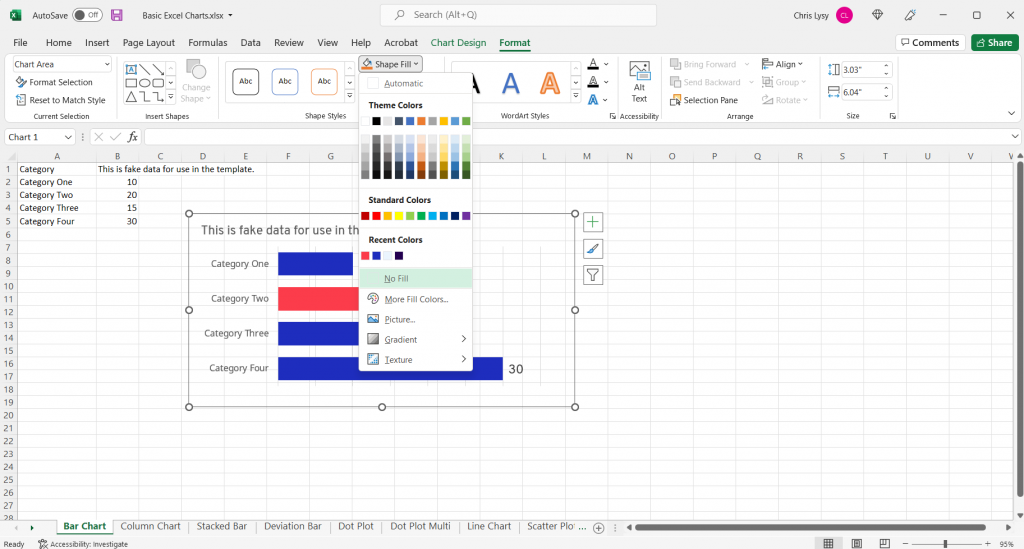
We’ll select the chart and go into the format tab. Then select Shape Fill and then “No Fill.”
This will give us the transparent background. You can quickly see why this isn’t Excel’s default, because a transparent chart in front of the spreadsheet blends in a little too much with the sheet.
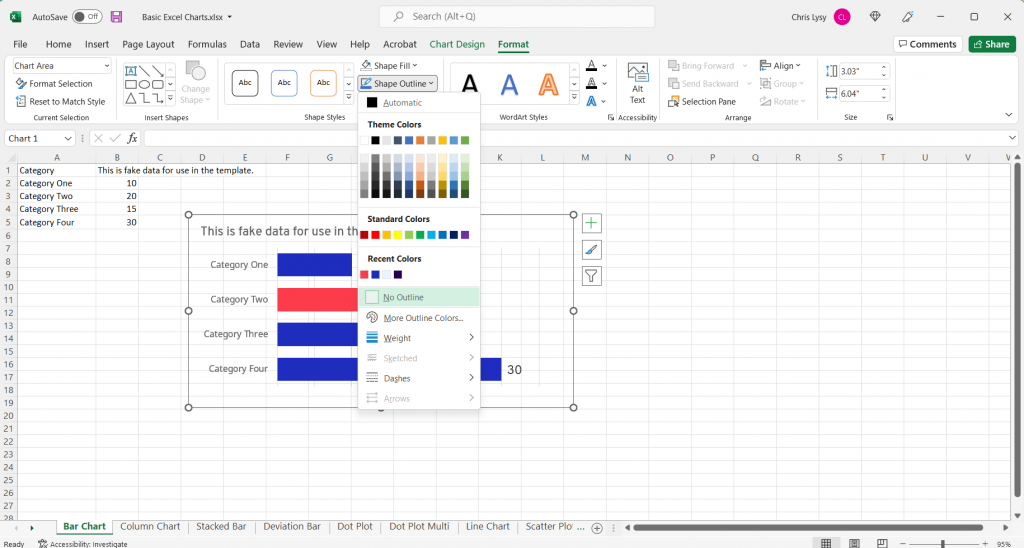
Another step you should take while you are here is to make the shape outline transparent as well by clicking on “No Outline.” Now this default setting I don’t get, it’s just annoying.
Now the Simple Copy Paste Works
Now that we’ve made the chart background go away it’s time to copy and paste again. The difference is that this time, the chart will have a transparent background and can be better placed within the Canva design.
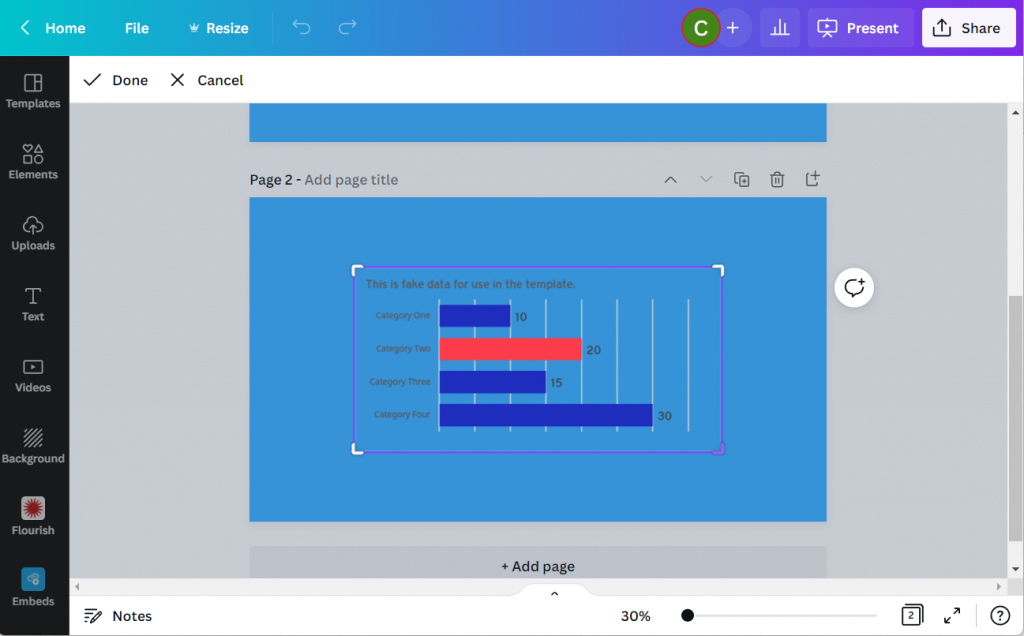
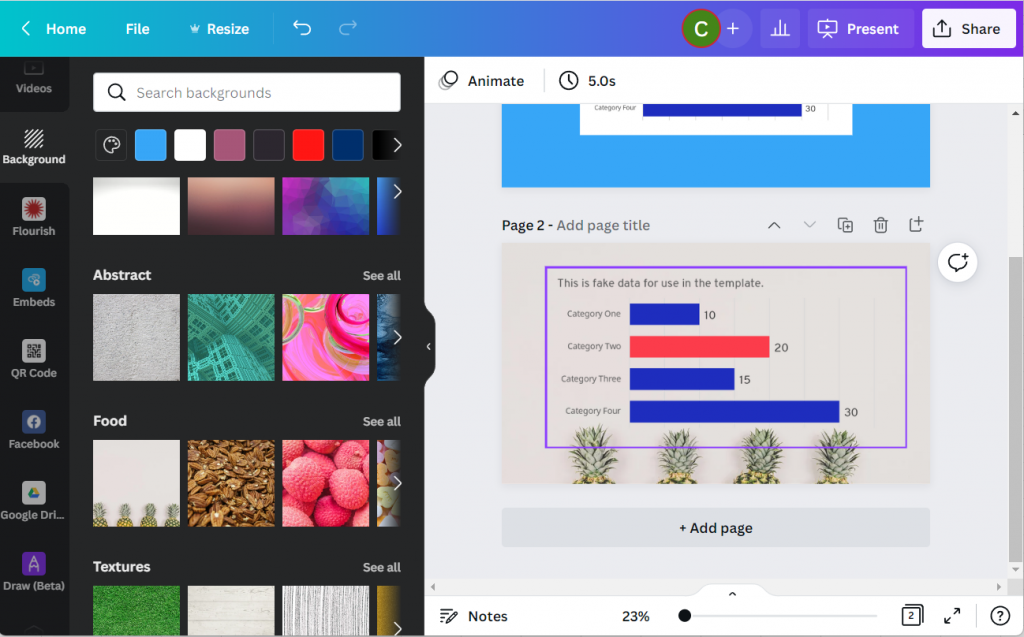
Did you know that Canva has a backgrounds menu? If you don’t see it on the left panel menu click on the “More” button at the bottom. You’ll find bunches of abstracts, textures, gradients, and photos ready to become backgrounds.
Like this super cool Pineapple background.
Bonus: Saving your Excel Chart as an SVG
Okay, want to take the cool factor one step further?
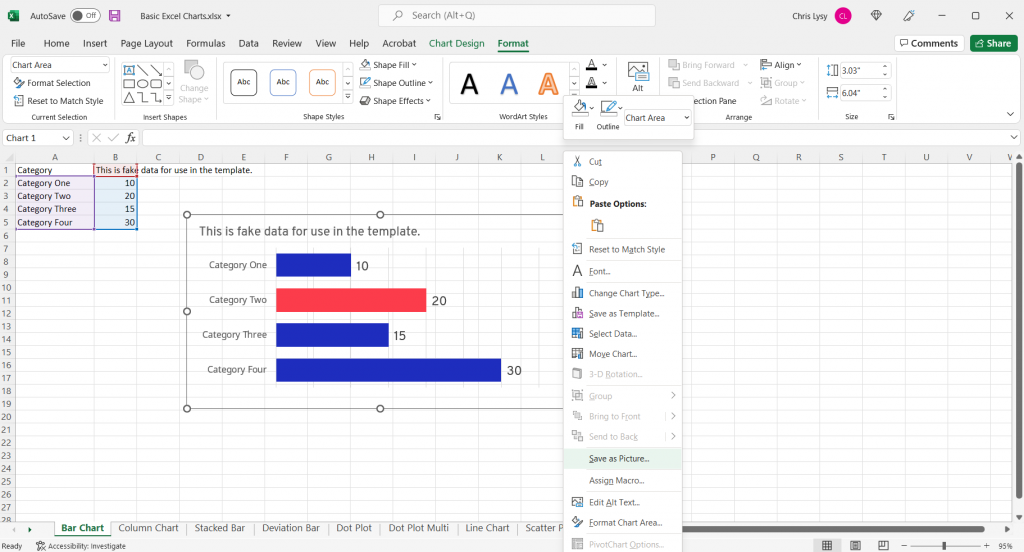
Instead of copy and paste let’s save the chart as a picture in Excel.
And not just any picture, let’s set the type to Scalable Vector Graphics.
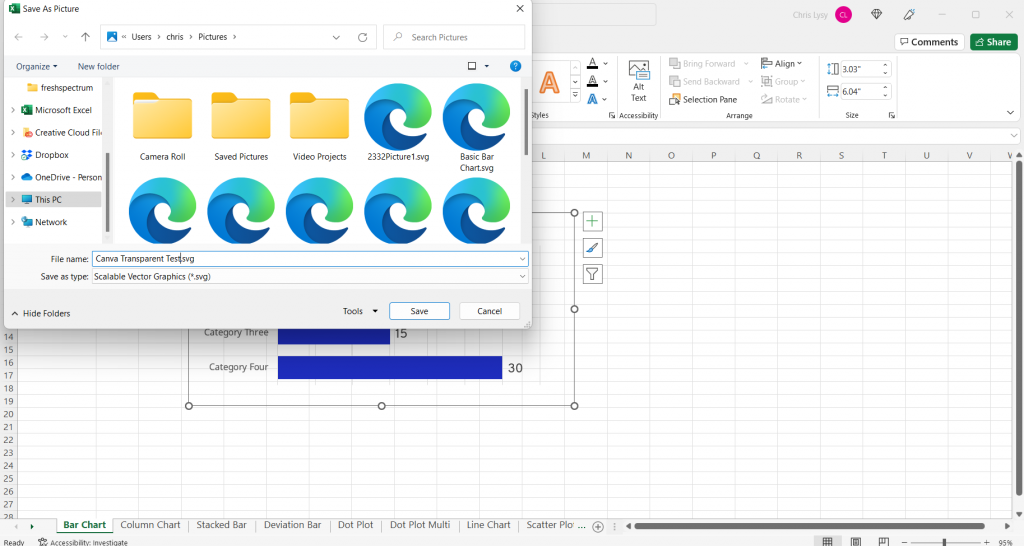
Then we’ll drop the newly created SVG chart into Canva.

In the uploads tab you won’t notice much of a difference between the transparent PNG and the SVG. But something has definitely changed.
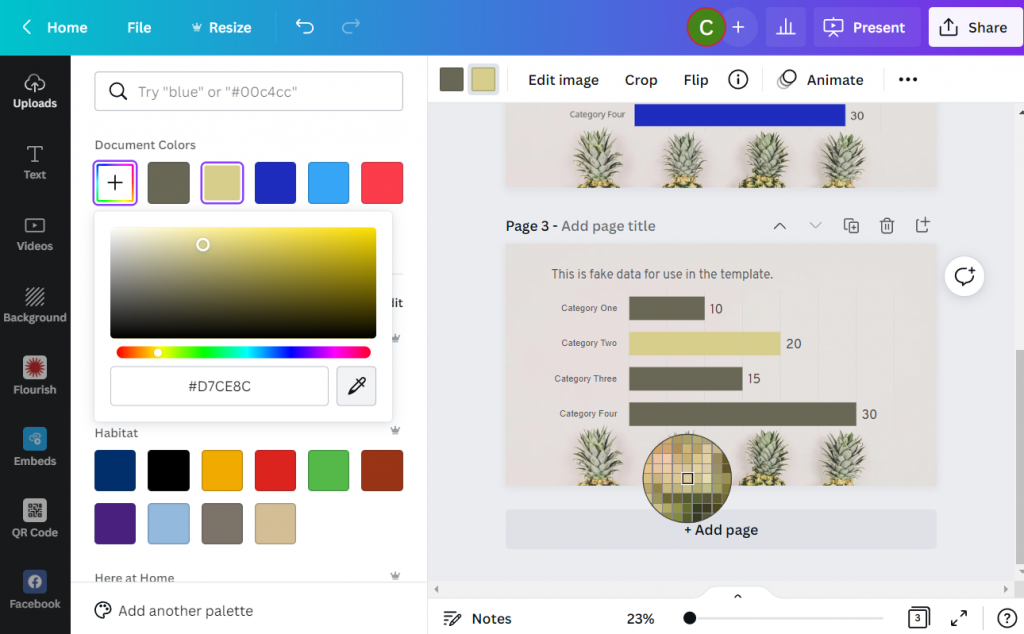
If you put the SVG in your Canva design, you’ll notice that you can actually change the colors!!! (I’ve tested this a bunch, and it has its limits. But for basic Excel charts you’ll be able to adjust most if not all of the colors).
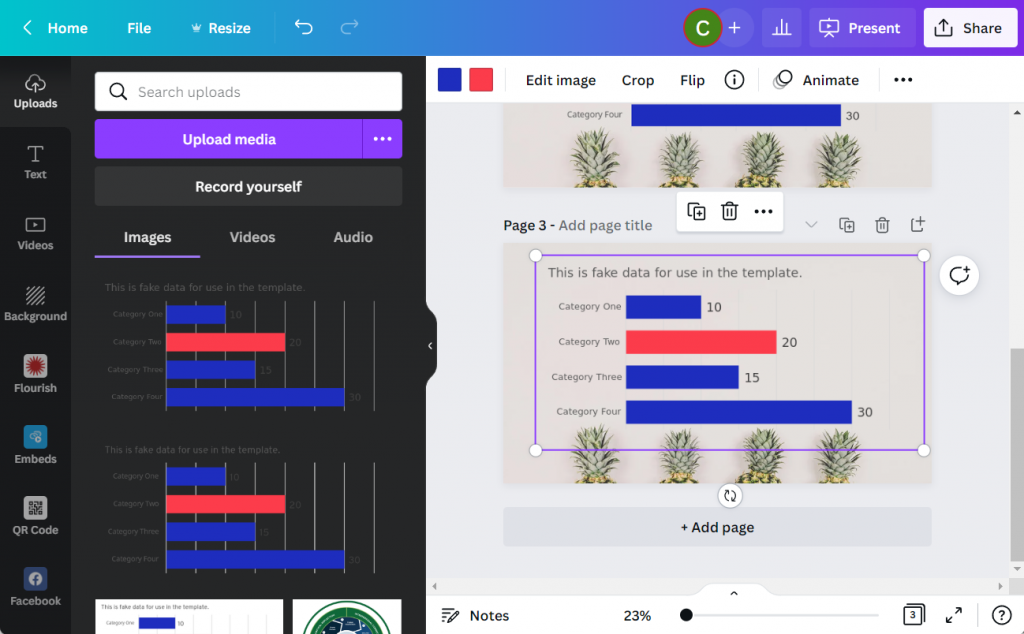
You can even use the eyedropper tool in the colors panel (the first one with the plus sign gives you the option). Now I can match my chart to the awesome pineapple background.
