This is an Eval Central archive copy, find the original at freshspectrum.com.
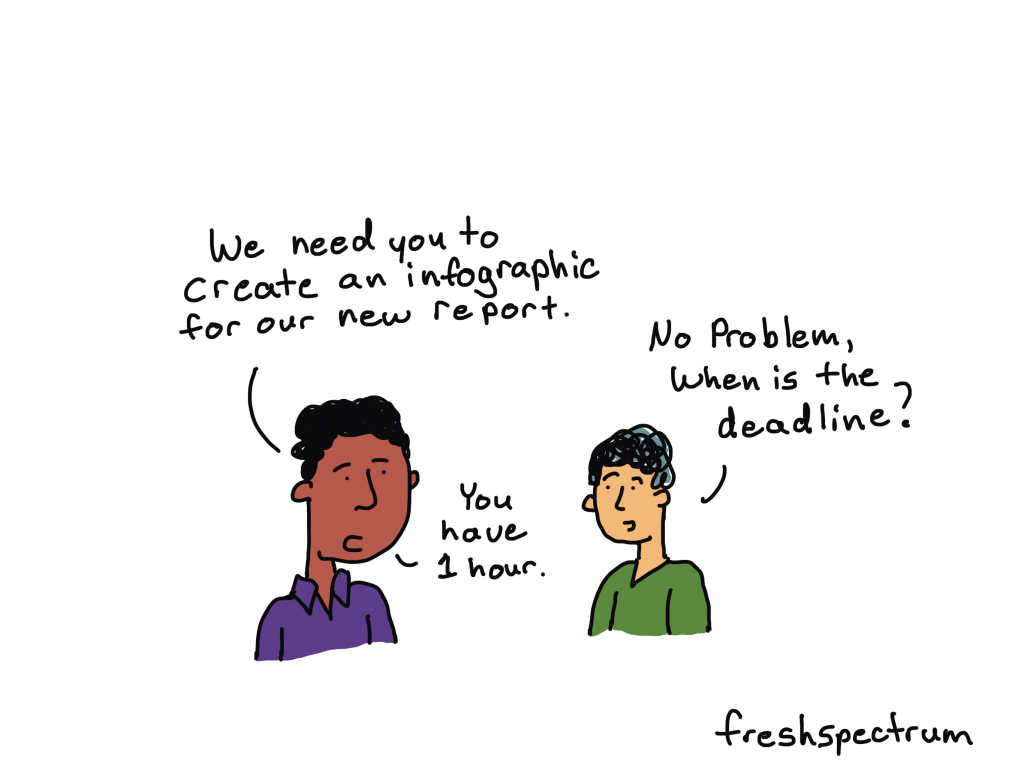
If you are not used to creating your own infographics, creating a professional infographic quickly might seem like a tall order. But sometimes deadlines call or you just need to create lots of infographics in a short amount of time.
In this post I’ll show you how to create an infographic quickly.
Just a note, I’m assuming you already know some information worth putting into an infographic format (such as a timeline) or you have some other kind of content you want to adapt into an infographic (like a report). If you don’t have information worth sharing, find that first!

1. Pick easy-to-infographic information.
A lot of times you’ll be creating an infographic from an existing report. But what inside the report should go into the infographic? There are certain things you’ll find in your report that are easier to infographic than others.
For example, these things are usually pretty easy to infographic:
- Recommendations
- Key Insights
- Chosen Methods
- Timelines
- Surprising Results
If a quick infographic is your goal, stay away from anything that requires a lot of explanation or subtlety. Infographics are engagement tools, ultimately you’ll want to send your audience back to the primary report for more detailed information.
2. Choose a simple infographic formula and style.
There are all sorts of infographic formulas and styles.
Start with shape and size. If you plan to print your infographic, make sure to design it in an easy to print format (such as letter size paper, legal paper, tabloid, A3, or A4). If you are sharing it on the web keep in mind where you are sharing the infographic and the platform limitations that might exist.
As for formulas, here are a few that make for easy infographics:
- Listicle infographics (i.e. 5 lessons learned)
- Timeline infographics (i.e. Successes over our last 4 years)
- Side by side comparisons (i.e. A tale of two program sites)
3. Find an infographic template.

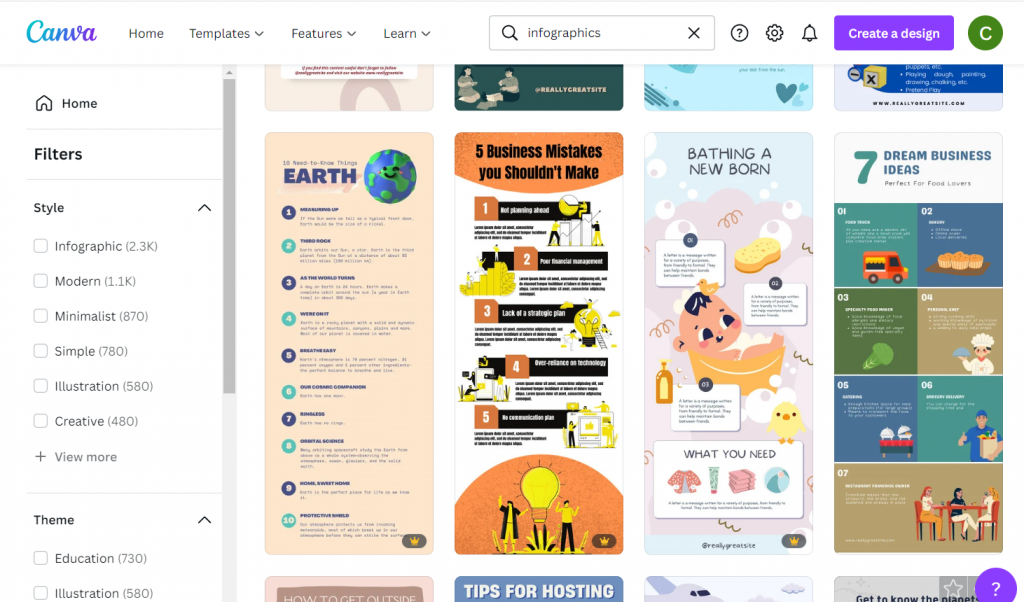
Once you have a basic idea of the type of infographic you are going to create, try to find a template before you start writing. There are other infographic template sites out there in the world, but I usually suggest starting with Canva.
There is a tendency to write too much when you are writing content for an infographic. You spend a lot of time making sure the words are just right only to find that they look super busy once you put them on the page. Choose a template that more or less matches the amount of content you want to share.
A template you like is also going to take care of a bunch of design choices around colors and fonts. If you have make the template match your brand it might take you a little more time.
4. Write an infographic script.
I prefer writing my infographic text outside of the infographic. It makes it easier to track change and edit if necessary. Then I just paste the text into the template.
Use the template you chose in step 3 to give yourself target word counts for each block of content. If you go far above or below the word count, it could really distort the look and feel.

5. Illustrate your infographic.
Now that you have the text, it’s time to add the pictures.
I suggest being consistent. Choose between photographs, illustrations, charts, cartoons, and icons as each will give your infographic a different look. Since we are creating this infographic quickly, I would suggest using stock visuals already included as part of Canva.
Another option is to upload your own charts and pictures.
6. Bring it all together, save, and share.
Now that you have your infographic all together and filled with content it’s time to give it the final touches. If you want to print your infographic (or share it as a printable) I would suggest saving it from Canva as a PDF. If you plan on sharing it via social media I would suggest saving it as a PNG.
If you share it on a website or on social media as a PNG, make sure to add alternate text wherever you share (i.e. WordPress, Twitter, etc.).
Want some resources, including a few Canva templates and an infographic script worksheet? Register for my free upcoming webinar.
Next week I’m holding a webinar to go along with the Summer registration kickoff for DiY Data Design. Hope you can attend!
Join us at 2PM on Thursday, June 9, 2022. Register on Eventbrite through this link.
