This is an Eval Central archive copy, find the original at freshspectrum.com.
Have you ever heard of the last mile problem?
It’s a concept that gets talked about a lot in discussions about supply chains and transportation services. But I also believe it applies to evaluation.
The general idea is that the last leg of a journey is the most complex. For instance, in areas with good transportation networks, it could be pretty easy to get a person from a city center by subway to an area nearish their home. But getting them that last mile (from the station to their home) is the most complicated, and often the most expensive, part.
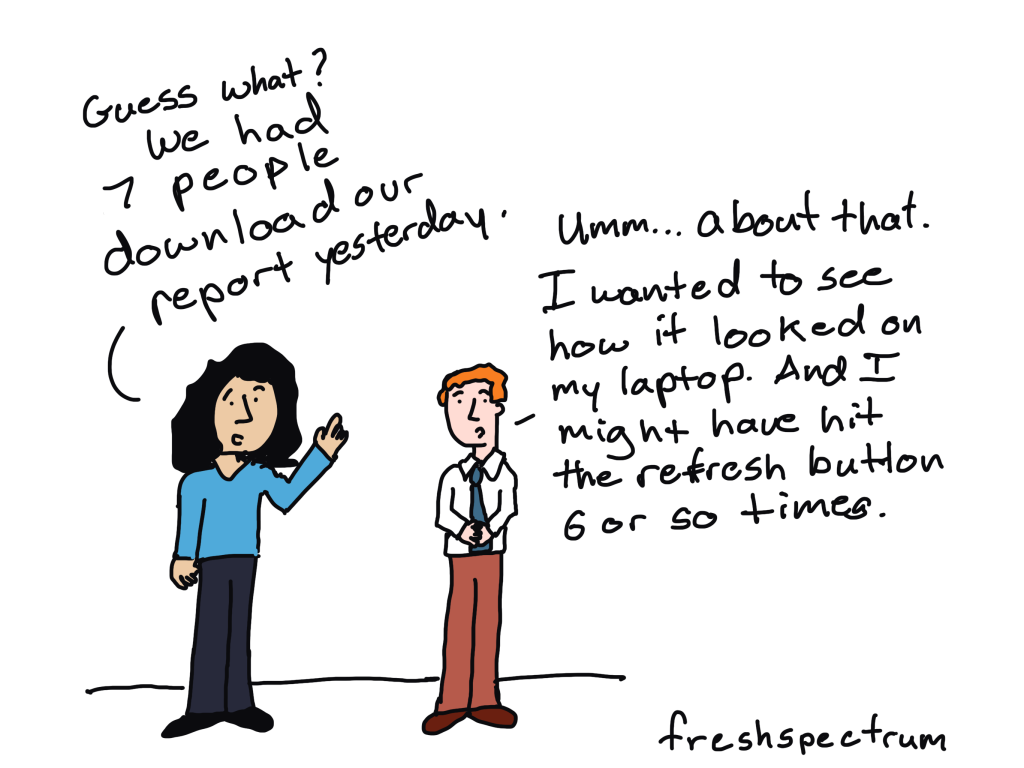
The biggest challenge I see in evaluation and research is that we do tons of work to get our evidence close to our audience. But instead of dealing with the complex last mile problem, we just give up and move on to the next problem.
It’s a waste of data.
And it’s that waste that has driven my career for more than the last decade.
But let’s break down the last mile problem a bit further. Here are three reporting mistakes that I see over and over and over again. They are mistakes that stop our data and evidence from reaching our intended audience. Each of these problems CAN be fixed.
Mistake #1 – The Single Report Problem.
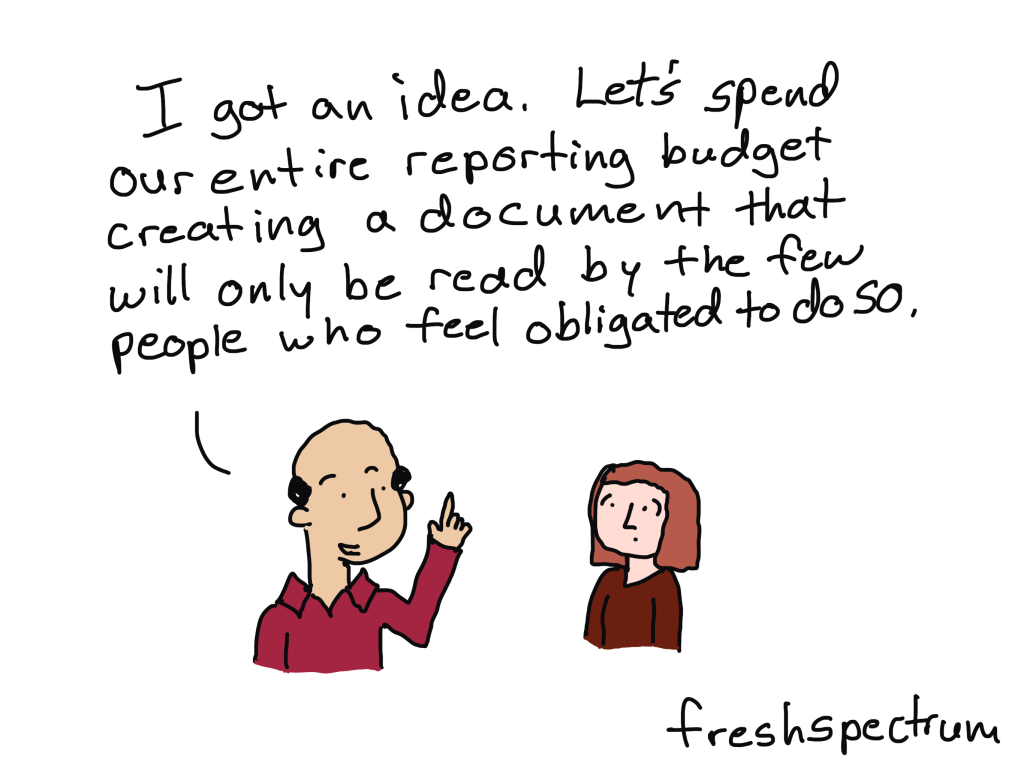
Here is the mistake.
The evaluation team completes their evaluation and delivers a comprehensive technical report to their client. The assumption then is that the client will be able to process the findings and then further distribute these findings.
What happens is that the handful of people who feel obligated to read the report will do so. Whether they act on any findings or recommendations depends on their ability to process the information shared and their motivation to share it forward.
Sharing it forward is the last mile. It requires adapting the materials to meet the needs of various audiences and communication channels. It takes work and a person who has the ability to translate the knowledge from the technical report to meet the needs of these different audiences.
The people in the best position to do the translation are on the evaluation or research team. But by the time it comes to share these findings, many have already moved on.
My Solution: Every technical report should be adapted into a collection of digital assets that facilitate sharing data forward. This is a step that should take place after the technical report is complete (or while it is being written).
Mistake #2 – The Unintentional Gatekeeper
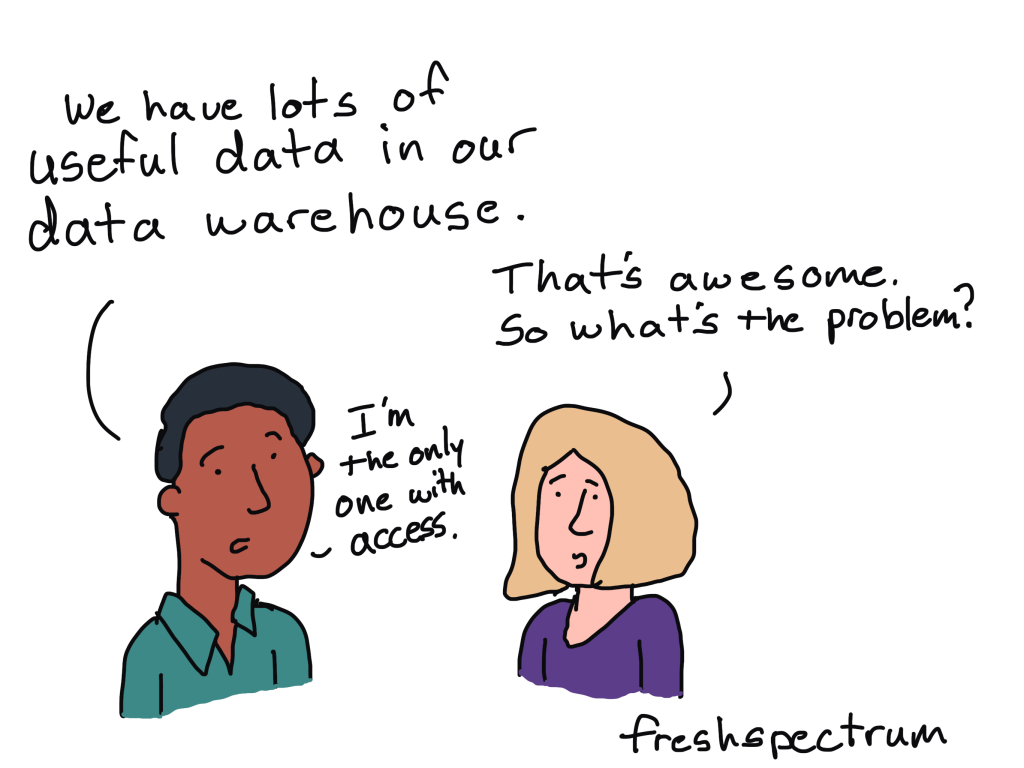
This happened to me pretty early in my career.
I had a high level of access to different data warehouses and datasets. But the folks working at program sites, who could potentially use this data, did not have the same level of access. And most did not have the same level of experience working with raw datasets.
This happens a lot. Potentially useful data is not shared with broader audiences. And not because there are unsolvable PII issues (Personally Identifiable Information for those not in the know). The reason is that it’s just in the wrong format and stored in the wrong place.
My Solution: Transform datasets and tables into simple dashboards. Not the kind that mimics car dashboards, but the type that sets up larger data sets for stakeholder exploration.
Mistake #3 – The PDF Problem
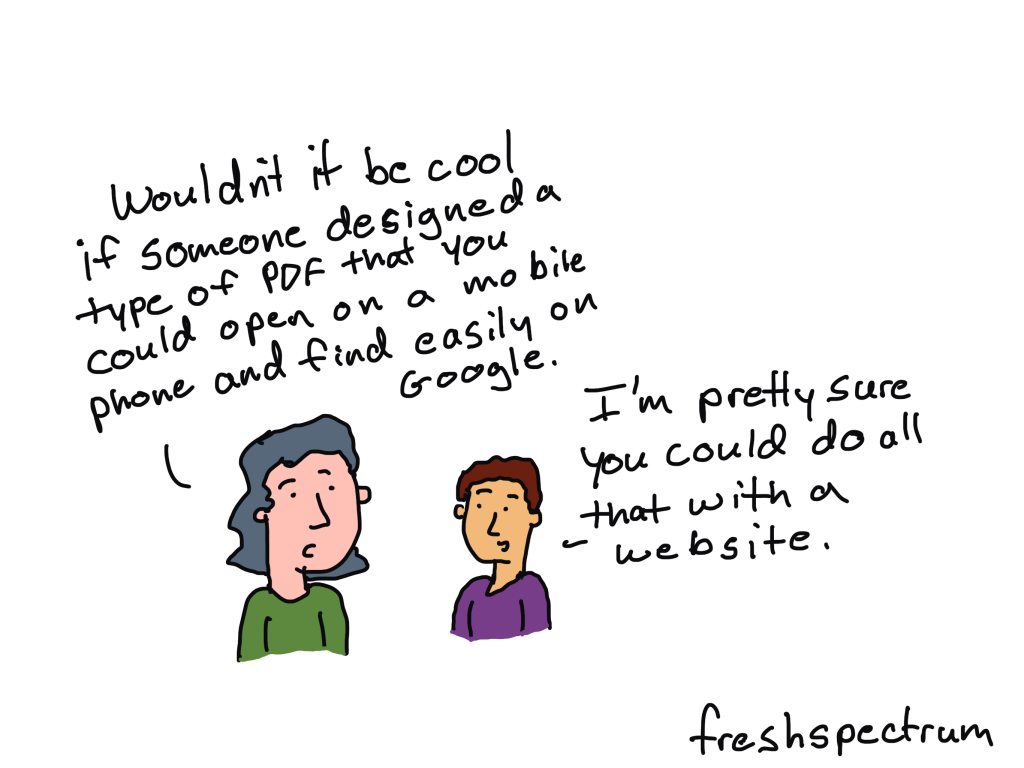
It’s time we move on from exclusively sharing our work through PDF.
Over half of web traffic is mobile these days. PDFs are not mobile responsive.
Google highly prefers HTML web pages to PDFs and will always prioritize non-PDFs in search results. In practice this means that a less useful resource could easily show up higher in search results merely because the alternative was only shared through PDF (the one you created).
PDFs are not auto-translatable. HTML web pages are, and will automatically be translated into over 100 languages just through the use of a modern web browser.
While PDFs have “accessibility features,” a simple HTML website is far easier to make accessible for a wide range of audiences with disabilities.
In other words, PDFs limit access.
My Solution: Adapt the PDF technical report or resource into HTML. I use WordPress.
Refer my services, PLEASE!
I’ll be honest. A big multi-year consulting project of mine ended in September.
So, I could really use some new clients to keep my business afloat.
The vast majority of my clients are either direct referrals from the researchers and evaluators who follow my work (I’m talking about people like YOU) or repeat customers.
The post above outlines the key problems I solve and the specific services I pitch. In shorthand, I create infographics, dashboards, and interactive reports for evaluators and researchers.
If you know anyone working on a report who might be able to use my services, could you send them my way?